
The Future of Longevity
In several recent posts I have tried to provide some information about life expectancy and measures of public health that might inform the current debate on raising the eligibility age for Medicare and perhaps Social Security. These posts focused on some basic facts about longevity trends over the last 50 plus years. I also highlighted differences in life expectancy for men and women and also the influence of race and socioeconomic on life expectancy. Finally, I made the point that behavioral and other risk factors that operate throughout life need to be addressed if we want to narrow the effects of sex, race, and money on life expectancy. In this data heavy post I want to focus on the future of longevity and ask what this might look like going forward. One idea is that life expectancy is going to continue to rise, and the other idea is that as a result of the obesity epidemic and other factors it is going to flatten out.
What the US Social Security Administration says
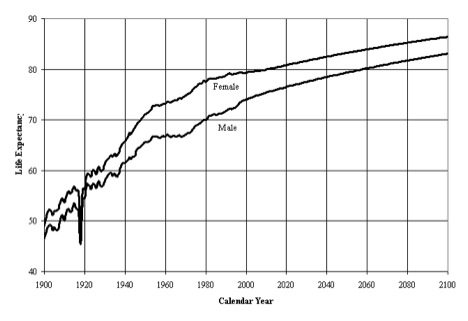
The next four figures are from the U.S. Social Security Administration (SSA) and might be described as the “official” estimates from 2005 for what might happen to life expectancy in the future. Here is a description of the first figure from the SSA report.
“The figure shows life expectancy at age 0, by sex and calendar year, based on period life tables. Rapid gains in life expectancy at age 0 occurred from 1900 through the mid 1950’s for both males and females. From the mid 1950’s through the early 1970’s, male life expectancy at age 0 remained level, while female life expectancy at age 0 increased moderately. During the 1970’s faster improvement resumed for both males and females. Life expectancy for males and females in the 1980’s improved only slightly with males improving more than females. In the 1990’s, life expectancy has remained fairly constant for females, increasing only slightly for males.”
The second figure is also from the same SSA report and shows trends and projections in life expectancy at age 65.

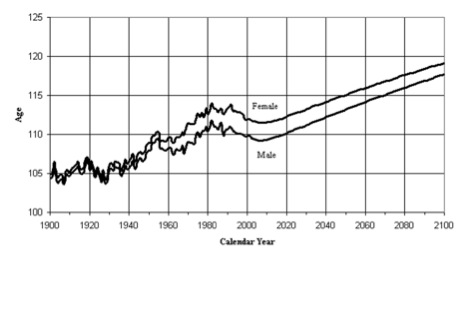
The third figure from the SSA report I want to show is about the age of the oldest of the old…….people who truly are one out of 100,000. For those interested in the topic of extreme aging here is a link to a list of the oldest lived people in history.
The final figure is comparative survival curves from 1900 to 2100. Here is a description of this figure from the SSA report.
“This figure presents the population survival curves based on period life tables for selected calendar years. Great strides were made in the twentieth century toward eliminating the hazards to survival which existed at the young ages in the early 1900’s. Very little additional improvement to survival rates is possible at these young ages. Survival rates at the older ages are projected to continue to improve steadily. Projected gains in the probability of surviving to age 90 during the next 50 years are about the same as experienced during the past 50 years. For age 100, projected gains are much greater than for the past. Figure 5 shows population survival curves based on period life tables for, from left to right, 1900, 1950, 2000 and projected years 2050 and 2100.
Although the shape of the survivorship curve has become somewhat more rectangular (less diagonal) through time, it appears that very little additional rectangularization will occur because survival rates are already so high at the young ages and are expected to continue increasing at older ages. The so-called “curve squaring” concept, though appealing to many, simply cannot be supported by the mathematics of mortality. The age at which the survivorship curve comes close to zero, through the compounding of single-year probabilities of survival, has increased greatly during the twentieth century and will continue to increase, as further strides are made against degenerative diseases. That mortality rates are found to continue to decline, at every age for which adequate data are available, demonstrates that no absolute limit to the biological life span for humans has yet been reached, and that such a limit is unlikely to exist.”

Looking past the Social Security data
As I noted in my introductory comments, there are two basic ideas about the future of longevity. The first idea is that life expectancy is going to continue to rise and that the curves above might be underestimating life expectancy in general and the fraction of people who make it to 100 or older in specific. If this occurs the public policy implications for the funding of and eligibility for Social Security and Medicare are problematic at best and a demographic time bomb at worst. Here is a quote from the article by Olshansky and colleagues:
“The cumulative outlays for Medicare and Social Security could be higher by $3.2 to $8.3 trillion relative to current government forecasts……….”
There are also concerns about the techniques used to make life expectancy forecasts for the Federal Government that might lead to underestimates over time. The second idea is that life expectancy is going to decline due to obesity and other factors. The people who take the position that life expectancy might fall are also concerned about the techniques used to make these forecasts and that they might lead to overestimates of projected changes in life expectancy.
Caveats & Conclusions about the future life expectancy and where this will lead
- Any changes in life expectancy are likely to be unequally distributed in the population at large. They are more likely to be seen in educated, well-connected better off people. Even in a country like Sweden where heroic steps have been taken to reduce health care disparities and inequalities, there are still health disparities and inequalities in life expectancy.
- The genetics of who makes it to 90 or 100 are not well understood and no obvious genetic markers that predict extreme old age have been identified. There is also some evidence that none will emerge with further research.
- My personal opinion is that trends in life expectancy will be divergent with some people trapped in a cycle of lifestyle related diseases and low social autonomy. There will be another group of long lived super guideline followers who will be generally well-educated and better off. These people will also be physically active, non-smokes, relatively normal weight, moderate drinkers, and engaged in life.

This entry was posted on Monday, January 21st, 2013 at 6:10 am and is filed under Current Events, Health Policy. You can follow any responses to this entry through the RSS 2.0 feed. You can leave a response, or trackback from your own site.
One Response to “The Future of Longevity”
Leave a Reply
LIKE MIKE

SUBSCRIBE TO RSS

March 1st, 2015 at 5:03 pm
The notion of ever increasing life expectancy is dependant upon a stable global environment. If Climate Change continues for example one can expect that a negative impact on longevity would result. If global relations among nations deteriorates that could also have a negative impact. Will the present global economic system that is creating significant levels of inequality could cause a world where economic wealth and power is concentrated in fewer hands.
I personally believe that we could very well be near our maximum life expectancy due to the factors I mentioned above.