
Bait & Switch: Longevity and the Medicare Eligibility Age
In a post last week I reviewed data on life expectancy and implications for the retirement age especially in the context of proposed changes in the eligibility of Medicare. Here is a link to a retirement age calculator for the U.S. Social Security system. For those born after 1938 the age gradually increases to 67 for those born in 1959. The retirement age for Medicare is currently 65, but up for discussion in the ongoing debates about the fiscal future of the U.S.
The idea driving the Medicare debate is that people are living far longer than they were when the program was started and thus an upward adjustment is needed to make Medicare demographically realistic and limit the explosive (and unsustainable) increases in costs for this program as the baby boomers retire. Opponents of this idea point out gains in life expectancy have been uneven and that most of the gains have been in relatively well-off segments of the population. There are also significant life expectancy differences based on race, education and sex (women live longer). Thus, the idea is that raising the retirement age would be “unfair” to certain groups. As I pointed out last time, no one ever brings up the general “unfairness” of these programs to men which I find a bit puzzling but will leave to the pundits to sort out.
The counter argument about the potential unfairness of raising the eligibility age for Medicare is that the real problem is what happens to or in the groups with lower life expectancy before age 65. In other words, the differences in life expectancy in various subgroups for those who make it to 65 or older in pretty good health are less dramatic than the differences in life expectancy from birth data would suggest. What follows are some examples of what happens to people before age 65 that might explain some of the socioeconomic differences in life expectancy.
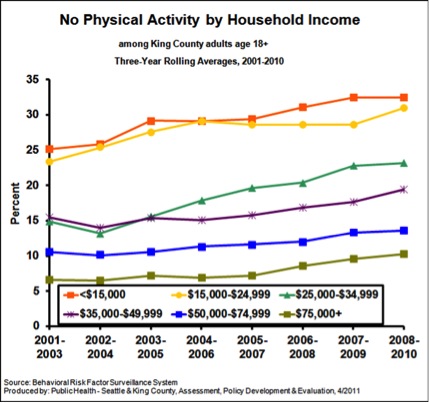
Physical Activity
The figure below is from King County, Washington (Seattle) and shows data on the influence of income on “no physical activity in the last month”. As I have pointed out repeatedly, physical activity is extremely protective against all sorts of problems and increases longevity dramatically.
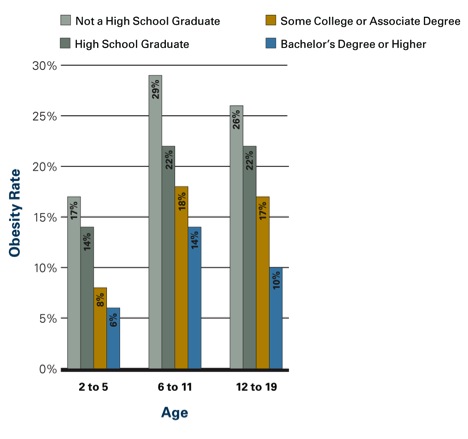
Obesity
The figure below shows the influence of parental education on obesity rates in kids. Similar data is available for adults. In adult women those with more education and higher incomes are less likely to be obese. In men the relationship is not as clear, but there is some evidence that better educated men are less obese the less educated men. However, the bad news is that obesity has increased for both sexes and all socioeconomic and racial subgroups in the last 20 plus years.
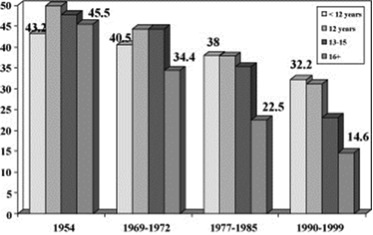
Smoking
The figure below shows data on smoking rates by education (usually a close correlate of income) and how they have changed between 1954 and the 1990s. Rates have fallen for all groups but most dramatically for the most educated people.
Social Stress
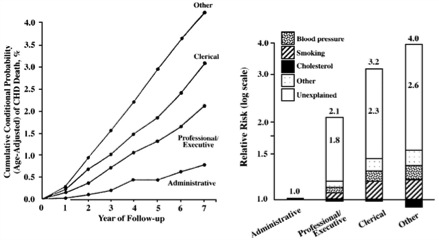
There is pretty good evidence that social status and what might be described as social stress and autonomy plays a role in the early mortality seen in less educated and lower socioeconomic status groups. In other words, poor and less educated people have less control over their daily lives and that is stressful and bad for their health. Social stress is also independent of traditional risk factors or access to care. The figure below shows how job category/education affects cardiovascular mortality in civil servants in England. The bar graph on the right of the figure is a “log-scale” so a bit distorted, but the overall picture is clear. The article points out that:
The cardiovascular mortality rate over 7 years in 17 530 London civil servants was more than 4% among unskilled workers, compared with 3% among clerical workers, 2% among professionals or executives, and less than 1% among administrators. The presence of identified risk factors, including cholesterol level, blood pressure, and smoking, explained less than half of these differences. All of these persons were working at the onset of the observation period and had access to medical care through the National Health Service. Therefore, neither biomedical risk factors nor limited access to medical care can account for most of the differences, and the major component of differences in the risk for cardiovascular death remains. We suggest an explanation based on lifestyle and behavioral considerations.
My bet is that the more educated and higher paid civil servants in the UK were much more likely to be physically active, watch their diets and otherwise comply with health guidelines and medical advice.
Summary
All sorts of issues including physical inactivity, obesity, smoking and social status/stress need to be addressed to reduce the effects of socioeconomic status, education and race on life expectancy. However, most or all of these issues need to be addressed prior to the age of 65 to have much of an effect on life expectancy. Most are also relatively independent of access to medical care. Confusing these issues, with the eligibility age for and long term finances of Medicare is an example of a policy discussion bait and switch.

This entry was posted on Thursday, January 10th, 2013 at 6:31 am and is filed under Current Events, Health Policy. You can follow any responses to this entry through the RSS 2.0 feed. You can leave a response, or trackback from your own site.
One Response to “Bait & Switch: Longevity and the Medicare Eligibility Age”
Leave a Reply
LIKE MIKE

SUBSCRIBE TO RSS

March 4th, 2013 at 2:05 pm
Medicare’s 2 for 1 Challenge! | Human Limits: Michael J. Joyner, M.D. says:[…] the retirement age. I have discussed this in detail before and challenged the idea that raising the retirement age is unfair to certain ethnic and socioeconomic subsets of the population with lower life expectancies. The […]