
Archive for the ‘Health Policy’ Category
Sin Tax Update
One topic I’ve posted on several times relates to the use of taxes, insurance premiums and other “nanny state” approaches to shape behavioral health. The basic idea is most of what ails a given population is driven by behavior and that focusing on individual choice or medical care after people are sick only gets you so far. Thus public policies that encourage better choices related to things like diet/obesity, smoking, drinking and physical activity are essential. In other words, make healthy choices more attractive, easier, and less costly in comparison to unhealthy choices. Here is an update on a few things related to this general topic.
Mayor Bloomberg
Mayor Bloomberg’s third term as mayor is coming to a close and the New York Times is running a series of articles reviewing his legacy. He has been a champion of using public policy to shape behavioral health. While Mayor Bloomberg gets mixed reviews from the citizens of New York on many topics, his efforts to reduce trans fats at restaurants, post calorie counts, reduce smoking , and promote physical activity have all gained high marks…….mostly in retrospect.
These policies were not particularly popular when they were first discussed and implemented and yapping about the so-called nanny state was and is common. However these policies have become much more popular and perhaps show that Mayor Bloomberg (for all his billions) is someone who “cares”. These findings should also give politicians and regulators the confidence that even if unpopular when implemented, such policies will likely become more popular with time. Can you imagine the outcry many places if smoking bans were reversed? It is interesting to note that the one unpopular policy is his effort to restrict the size of sugary drinks. Is that because it is his latest effort, or is regulating what people eat and drink going to be more difficult than things like smoking bans?
Penn State Health Insurance Plan
Another interesting news report comes from Penn State where there appears to be significant (or at least high visibility) push back on efforts to link health-care premiums to the behavior of employees.
The opponents of the plan cite privacy and other concerns. It will be interesting to see what happens as more and more organizations and perhaps governments start to charge different rates for health insurance based on behavioral risk factors that are at least under some control or perhaps a lot of control by any individual policy holders. There’s some evidence that these policies work to get people to change behavior, but will it be acceptable and how much political pushback will there be?
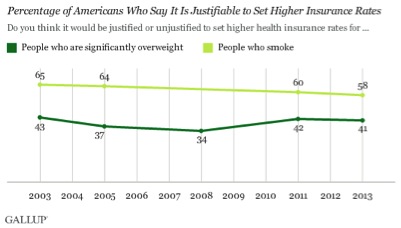
Gallup Poll Data
The chart below from the Gallup Organization tracks responses of the general public to questions about higher insurance premiums for smokers and people who are overweight. The link also shows how opinion varies by political affiliation, smoking status, and self-reported obesity/overweight. While there is significant support for adjusting premiums, there are plenty of people who oppose this strategy even for smoking.
Summary
It is hard for me to think that we are going to make the country much healthier without a bigger effort to change unhealthy behaviors. Insurance premiums are going to be part of the mix and it will be interesting to see if they become widely adopted and how long it takes. My bet is that they will become widely adopted and it might not take as long as people think. The current smoking restrictions and seat belt laws would have seemed inconceivable 20-30 years ago.

Health Care Costs:
It has been a while since I did a post on big picture issues related to health care in the U.S. In the last couple of months several ideas or perhaps rescue fantasies have emerged or perhaps re-emerged and I want to go over them.
1) Lack of Price Transparency
In the U.S. prices for various medical procedures are convoluted, idiosyncratic and extremely hard for even the experts to understand. A recent NY Times article on the costs of having a baby in the U.S. highlights many of these issues. Because there is no obvious rack rate and prices are not posted by most medical providers, some employers are essentially capping what they will pay for a given procedure or service. Along these lines, my bet is that there is going to be a big price transparency movement, more so-called bundled payments, and that the regulators will play a role in this. The important thing to remember is that what people and insurance plans actually pay typically has little relationship to what the list price is if you can find it. The other point here is that even if prices are more transparent it might not do that much to lower overall medical care costs which are driven in large part by utilization of services. I am all for more transparency, but it is not going to solve the cost problem. It is also interesting to note the late physician turned science fiction writer Michael Crichton raised many of these issues in a long article in the Atlantic published in 1970!
2) Rising Costs: a Problem Everywhere
The next point I want to make is that rising prices are a problem in almost all rich countries and a number of developing countries. Many of these countries have strict price controls and essentially government run programs. So thinking that there is some magical intervention “the government” can or should do to fix the problem is simplistic at best. My bet is that Obamacare will struggle to contain costs. The real drivers of rising costs are likely the aging population and advances in technology.
3) The Recent Slowing of Health Care Spending Growth
The rate of growth of health care spending has slowed recently. If this trend continues it has all sorts of implications for things like the U.S. Federal budget. However, I would urge caution in assuming that this trend will last forever. In past economic slowdowns there has also been a slowing of medical care spending growth followed by a rebound when the economy picked up. As I pointed out above no government in the developed world has effectively dealt with this issue over the long run, the population is still aging, and technology marches on.
4) Denial & Practice Variation
The current focus on price transparency and the recent slowing of spending growth are major distractions away from at least one major issue that might tend to reduce the rise in spending over time. That issue is the tremendous regional variation in the use of health care services in the U.S. and the lack of relationship between a number of markers of utilization and outcomes. Some argue that 30% of Medicare spending does not contribute to improved patient outcomes and is thus “wasted”. The figure below is a bit dated but still relevant and generally accurate. It shows a range of estimated savings for Medicare if all 50 States had utilization rates and practice patterns similar to the five most efficient States. Numbers in these general ranges likely apply to health care spending as a whole.
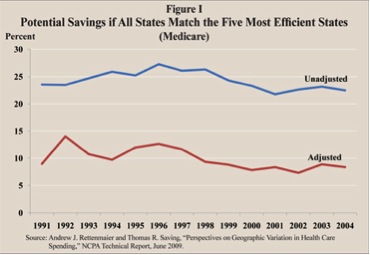
There are a number of ideas out there about how to deal with this issue, but they are likely to be challenging to implement.
5) Rent Seeking & Why This is Hard to Fix
Almost 18% percent of the GDP is spent on health care in the U.S. Almost 50% of this spending comes from the government in terms of either programs like Medicare or Medicaid, the VA, or Indian Health Service. Additional government spending is due to insurance provided to government workers at the Federal, State, and Local levels. There are also significant government subsidies for health care spending via the tax code. So, in one form or another “the government” probably covers 60-70% of medical costs in the U.S. As a result there is a huge and diverse group of vested interests angling for either maintaining or expanding their piece of this economic pie via what might be characterized as ‘rent seeking’ behavior:
“…..rent-seeking is an attempt to obtain economic rent by manipulating the social or political environment in which economic activities occur……”
Summary
Dealing with the high cost of health care in the U.S. is going to take more than price transparency and don’t bet the farm that current moderation of rising costs is going to last forever. The 800 pound Gorilla in the basement is utilization which, given the aging population, ever more technology, and economic incentives to over utilize, will be very difficult to contain.
Is Obesity a Disease?
The recent and controversial AMA decision to categorize obesity as a disease has a raised a number of questions and discussion points. I thought I would cover a few here to help readers sort through the issue on their own.
Definition of Disease
Below is an extended quote from the wiki definition of disease. It is similar to other definitions I found and if you link to the site there is a pretty comprehensive discussion of the concept of disease and related things like “disorder” or syndrome. Based on the blurb below obesity certainly seems to fit many of the definitions of a disease. One interesting recent observation is that if you track obesity in social groups it moves through them with a pattern that looks a lot like the way infectious disease moves through a population.
“A disease is an abnormal condition that affects the body of an organism. It is often construed as a medical condition associated with specific symptoms and signs.[1] It may be caused by factors originally from an external source, such as infectious disease, or it may be caused by internal dysfunctions, such as autoimmune diseases. In humans, “disease” is often used more broadly to refer to any condition that causes pain, dysfunction, distress, social problems, or death to the person afflicted, or similar problems for those in contact with the person. In this broader sense, it sometimes includes injuries, disabilities, disorders, syndromes, infections, isolated symptoms, deviant behaviors, and atypical variations of structure and function, while in other contexts and for other purposes these may be considered distinguishable categories. Diseases usually affect people not only physically, but also emotionally, as contracting and living with many diseases can alter one’s perspective on life, and their personality.”
Defining Obesity
BMI or body mass index has emerged as a favored definition of obesity. This definition is probably OK when thinking about groups or populations of people but does not always tell you much about an individual. There can be “normal weight” people with a lot body fat and health problems, and there can be heavy people with lots of muscle mass and very little body fat. Then there is the problem of distribution of fat. Visceral fat or “belly fat” is worse for your health than fat in your lower extremities. When I started medical school in the early 80s fat was seen mostly as a tissue that simply stored excess energy, but in the last 20 or so years it turns out that some fat cells secrete all sorts of biologically active substances that wreak havoc on the blood vessels, heart, liver, pancreas, skeletal muscle and brain. One critical thing to note is the physically active “fat people” are largely protected from some or most of these problems
What Does Disease “Status” Do?
The AMA decision does not do anything right away other than make a statement and raise a bunch of questions:
- Will disease status increase public awareness of obesity as a medical problem? My guess is that most people are probably already aware that obesity is a problem.
- Will disease change medical practice and encourage more Drs. to discuss the issue with patients? Should things like exercise and physical activity be a vital sign?
- Will disease status influence the way insurance covers certain treatments like gastric bypass? Some plans do, some don’t and here is link to a nice opinion piece on that topic. What happens if the insurance plans that political leaders get cover it but not the plans the rest of us have?
- Will disease status limit the use of sin taxes and incentive plans linked to weight loss by governments and insurance companies?
- Will disease status encourage people to take more or less responsibility for their own behavior? Obesity is a lot more than a few bad genes “making us fat”. In fact genetics likely plays a minor role for most people and the big increase in average body in the US over the last couple of generations has occurred faster than any genetic changes that might explain it. For the vast majority of us it is all about the environment and our behavior.
Our Obesogenic World!
We live in a high calorie low physical activity world primed to make us all fat. At some level it is amazing that anyone remains normal weight. The lessons from improved traffic safety and smoking rates over the last 50 plus years tell us that these big public health problems require structural changes in society as well as changes in individual behavior and so-called “choice”. Where to start with the obesity problem: Sugar and fat taxes or other policies designed to reduce calorie consumption and increase healthy food choices? Walking and biking friendly urban planning? Safe streets to encourage getting outside in all neighborhoods? More PE and better nutrition at school? Financial incentives via health insurance plans? Limiting our own screen time and that of our kids? Drs. and nurses communicating more about the problem with patients with easier referrals to diet and exercise programs? The short answer is all of the above.
Life Expectancy & Entitlements: Economic Inequality or Behavioral Inequality?
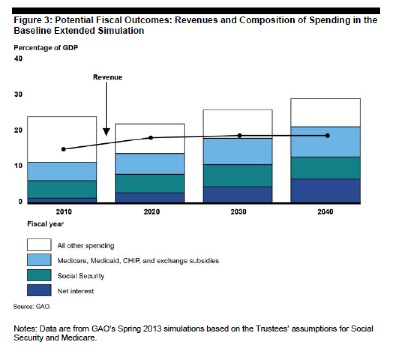
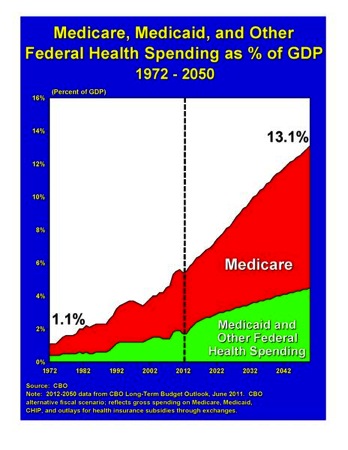
Discussion about the retirement age and reforming Medicare and Social Security spending is likely to be a long term part of the political debate (or is it gridlock) in the U.S. The well respected Economist magazine based in London suggests that President Obama’s legacy is dependent on getting entitlements under control so that the U.S. can spend money on other things. The rationale for this is laid out in the graph below that comes from the most recent projections from the non-partisan and independent Government Accountability Office (GAO). It is the most optimistic scenario in the GAO report. The point is that we are headed to an unsustainable financial situation if Social Security, Medicare and other health spending, along with interest payments by the Federal Government are not brought under control. One way to control these costs is to increase the retirement age to reflect the fact that life expectancy has increased dramatically since Social Security and Medicare started. The primary concern with raising the retirement age is that most of the gains in life expectancy have occurred in better educated people who also tend to have higher or even much higher incomes. So raising the retirement age is seen “unfair” by some commentators.
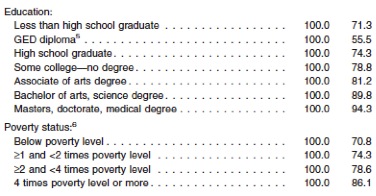
Health Behaviors Education and Income
The next three graphics come from a recent CDC report about the state of U.S. heath from 2008-2010. The first is a table that shows the impact of education and income on smoking rates. The column on the right is the percent nonsmokers. Less educated and/or lower income people smoke a lot more than better educated higher income people.
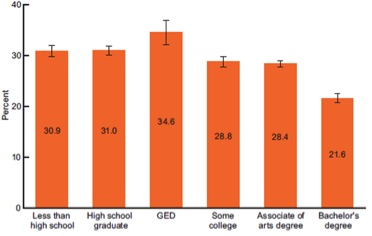
The next two graphs show the impact of education on physical activity and obesity. There is a similar effect of income on physical activity and obesity and as I noted above education and income are highly correlated.
PHYSICAL ACTIViTY vs. EDUCATION
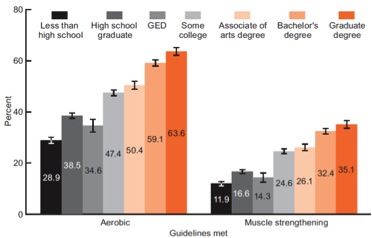
OBESITY (BMI > 30) vs. EDUCATION
What is the Real Problem?
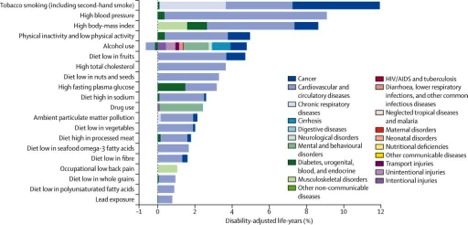
I have discussed this topic before and it seems to me that what is unfair is that aggressive steps are not being taken to address these issues in a comprehensive way for all Americans. A couple of posts ago I showed you what key risk factors alone and in combination did to life expectancy to a cohort from Scotland. From what I can tell each of the key risk factors above is worth about 3-5 years of life expectancy and the data above suggest that on average well educated/higher income people have about 1-2 fewer risk factors than poorly educated/lower income people and that difference explains most of the difference in life expectancy between groups. The other key point is that the risk factors above are independent of access to traditional medical care which may not do much to improve the health of low income people with limited access to health care. There is a lot of denial about all sorts of things in the current political and public policy arenas. Failure to aggressively address key behavioral risk factors for the population as a whole and especially for less educated/lower income people is a good example of just how pervasive this denial is.
Health vs. Health Care Spending
A few weeks ago I showed a couple of graphs on the relationships between income, happiness and life expectancy. The graphs demonstrated what can be described as a diminishing returns relationship with more and more resources required to generate even modest improvements in either happiness or life expectancy with an eventual flattening of the relationships. A similar trend exists for health care spending per person and life expectancy across the world.
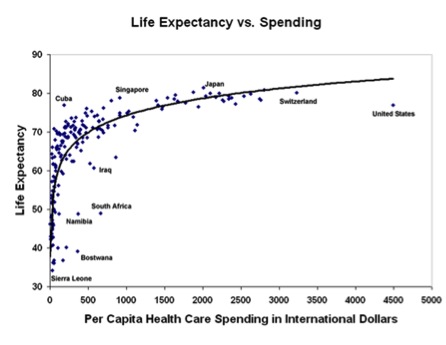
Is the U.S. Underperforming?
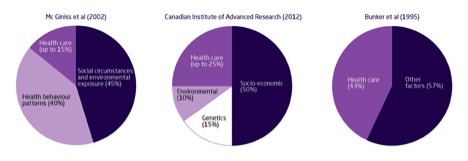
A quick look at the graph above clearly suggests that the U.S. health care “system” is underperforming. But before anyone jumps to that conclusion it is important to ask what the health care system has to do with broad based measures of public health like life expectancy? The next graph is a summary by the King’s Fund in the UK from three studies that have addressed this topic. The point is that in two of the three studies traditional health care is a minor (15-25%) determinant of health. My personal take based on a lot thinking and reading on this topic is that the Mc Ginness 2002 breakdown (15%) is probably the most accurate of the three. In this context, most of the life expectancy problem in the U.S. is about health behaviors and social circumstance as opposed to the health care system. That having been said, there are plenty of ways to look at what is wrong with the U.S. health care system like uneven access to care, uncoordinated care, excess use of technology and high costs; but life expectancy per se is probably not a good metric.
Will a “Better” Health Care System Fix the Problem?
In the UK significant resources have been devoted to developing and improving access to health care and coordinating this care via the National Health Service (NHS). There has also been an effort to make sure that only evidence based treatments are used and that technology is appropriately deployed. While the fraction of the GDP spent on health care is much lower in the UK than in the US, costs have gone up dramatically in the past decade or two. Has this worked? The UK lags behind most of the EU15+ countries (the original 15 members of the EU, Australia, Canada, the USA, and Norway) in many indices of health in spite of the efforts of the NHS. The graph below shows that most of the problem is related to life style and things like smoking, drinking, diet and exercise. Again, things that are relatively independent of the health care system.
Life Expectancy and Women in the U.S.
In general life expectancy for women is a few years higher than for men. However, recent evidence suggests that life expectancy for less educated and poorer women is actually falling. This fall in life expectancy highlights the limits of health or medical care on public health and reinforces that it is all (or at least mostly) about choices, lifestyle and social circumstances.
Summary
The point of this post has been to try to dissociate some of the criticism of the U.S. health care system from these broad based markers of public health. There is plenty wrong with health care in the U.S., but the real problems for the population as a whole are driven by a combination of personal choices and social forces that dwarf both the many negatives associated with our fragmented health care system.
Medicare’s 2 for 1 Challenge!
I want to get back to issues associated with Medicare in specific and the demographics of aging in general. Part of the reason for this is that the rate of increase in Medicare spending seems to be slowing a bit and that is leading at least some of our political leaders and commentators to suggest we pay less attention to the long term implications of Medicare spending for the U.S. Federal Budget and economy. That having been said I want to make a few points that we should all be thinking about in terms of our own retirement planning, our kids and also friends and relatives who are older.
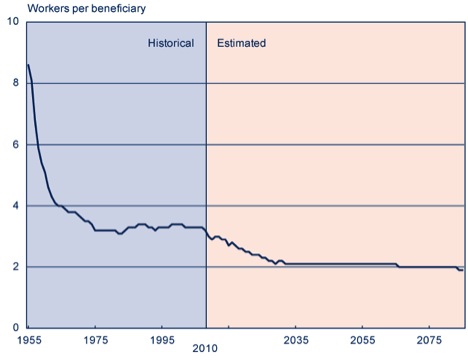
Point 1: The number of workers per retiree continues to drift downward.
The figure below is from the Social Security Administration and it shows both historical data and future projections for the number of workers per retiree. The magic number here is that over the next 20 years, if nothing changes, this ratio is going to drift downward from about 3.4 to 1 and stabilize at roughly 2 to 1. Medicare (and also Social Security) is ultimately a pay as you go plan. So the question is how much can we expect younger workers to pay to cover benefits for older people? This is especially interesting because for better off older people, we currently have a situation where younger people of modest and limited means are essentially subsidizing a large portion of their health care costs. Is this a wise policy? Is it fair? Is it even ethical?
Point 2: What Happens After the Baby Boomers are Gone?
I did a little thought exercise with my friend and colleague Bob Smoldt, an extremely experienced medical administrator, who has great expertise about all of the economic aspects of health care. I asked Bob what is projected to happen after 2045 when about half of the baby boom generation (born between 1946-1964) will likely be dead. My thinking was that once we are over the demographic hump associated with the baby boom, perhaps the number of beneficiaries would stabilize or drop and the 2 to 1 ratio would get better. Here is an excerpt of his response:
“What happens after baby boomers are gone? Does the problem get better? It is quite interesting. Here is what the latest Medicare Trustees Report (2012) projects:
Number of Medicare beneficiaries
- 2045 = 88.7 million
- 2055 = 93.3 million
- 2065 = 99.8 million
There is no decrease projected. I assume this is at least partly because of expected increase in life expectancy. So if you want to save entitlements by having the Baby Boomers die off — they better do so more quickly……
Ratio of workers (people paying the bill) to beneficiary
- 1970 = 4.6
- 2010 = 3.4
- 2030 = 2.3
- 2085 = 2.1
Workers per beneficiary levels off from 2030 – 2050 and then declines even further to 2.1. I don’t know why Social Security is different, but they project workers per SS beneficiary going down to 1.9. I was a bit surprised by this, but there is no magic bullet here. It just keeps getting worse — we will basically be at 2 workers per beneficiary “
Point 3: Potential Solutions.
It seems to me that these statistics are pretty hard to ignore and that sooner or later Medicare is going to have to be reformed. Here are a couple of ideas about what to do that could be adopted alone or in combination.
- Raise the retirement age. I have discussed this in detail before and challenged the idea that raising the retirement age is unfair to certain ethnic and socioeconomic subsets of the population with lower life expectancies. The issue here is largely who makes it to 65 vs. survival after age 65.
- Means test benefits so that well off people get less. This is an old idea and the link earlier in the post on younger people subsidizing well off older people discusses how this might work and includes adjustments for groups with lower life expectancies.
- The other idea is so-called premium support similar to what members of Congress get. Here is a comparison of several proposed plans. This idea has recently been derided as “VoucherCare” by liberal political commentators even though it was originally proposed by liberal think tanks.
Answers From Scandinavia?
Some conservatives love to make inflammatory comments about how President Obama is trying to turn the U.S. in to Western European style social democracy with a cradle to grave welfare state. I have a different observation; countries like Sweden are in fact reforming their social welfare systems much faster that the U.S. is via things like raising the retirement age and going to defined contribution funding models. The Swedes for all their alleged liberalism seem to be recognizing demographic reality and dealing with it. While Sweden changes the U.S. is trapped in a vicious cycle of demographic denial.
Health Care Spending Facts & Sequestration
As part of the political trench warfare over taxes, spending and the long term federal debt the next big hurdle is so called “sequestration” on March 1st. If the President and Congress can’t agree on a combination of spending cuts and tax increases then a series of automatic cuts will take place. Behind all of this bickering is one simple fact. Medicare and other federal health care spending has risen from a tiny fraction of the federal budget to about 20% and is slated to continue to grow as the baby boomers retire. In this post I want to give you some background information via 5 slides that will be useful to frame later discussions about what to do about Medicare in specific and health care in general. The figure below comes from the Senate Budget Committee and shows key trends and future projections as a % of GDP. Also remember the U.S. spends a higher fraction of our GDP (about 18%) on health care than any country in the world.
Overall Health Care Spending
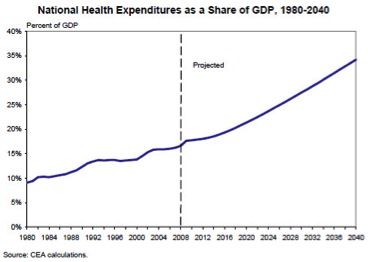
The next figure is from a White House report in 2008 (before Obamacare) and it shows what is projected to happen to total health care spending in the U.S. economy well into the future in the absence of significant “reform”.
An Unbiased Look at Medicare
For anyone want to take a deep dive into Medicare, the Kaiser Family Foundation has a series of slide shows on Medicare that cover almost every element of the program starting from the late 1960s. That having been said, I want to share three of the more than 120 slides posted on their website.
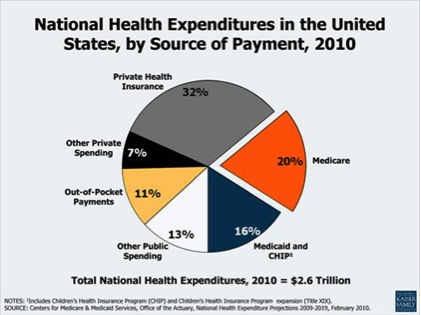
Kaiser Slide 1: “The Government” Pays 50% of the Bill.
The first slide is for anyone who has any doubt about just how much of the nation’s health care bill is paid for by the “government”. The magic number was roughly 50% in 2010 when you add up all programs (including employee benefits) at every level of government. So everyone needs to accept the fact the government involvement in health care is here to stay and we need to focus on how to deploy these resources in smarter ways.
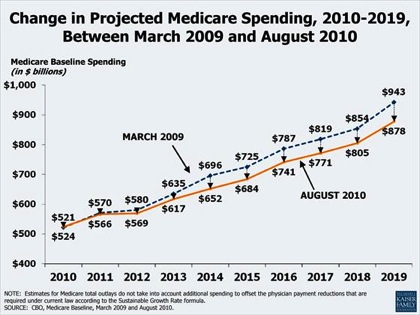
Kaiser Slide 2: Does Obamacare Bend the Cost Curve?
The next slide shows projected Medicare spending until 2019. The top line was pre Obamacare and the bottom line includes assumptions about costs savings as a result of it. The key point is that Obamacare does not move the needle that much. Additionally, the continuous upward trend shown in the 2008 White House slide above suggests that the many efforts at cost containment since 1980 have had limited effects on the growth of spending. In a later post I will discuss how much things like price controls, bundling, and potentially limiting access to technology have done so far when the “heavy hand of the Feds” has attempted to intervene to reduce the rise in health care spending (the short answer is not much).
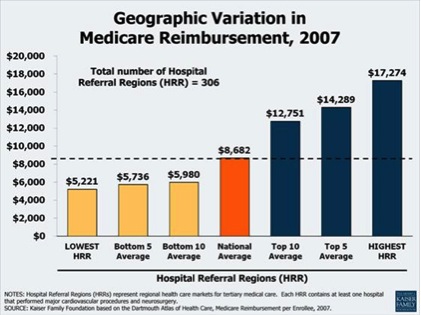
Kaiser Slide 3: Medicare Spending is All Over the Map!
The final slide shows how average Medicare spending varies more than threefold depending on where someone lives. The reasons for this variation have been debated and are complicated but overuse of services (e.g. doing things of little or no benefit to patients) is a major cause. This data also suggests that if more conservative and coordinated practice styles were adopted nationally there could be substantial cost savings for the country with no decrement in the quality of care provided to patients.
Summary
Health care spending in general and Medicare spending are complicated and emotional topics. The points I want to emphasize via the 5 slides above include:
- Spending is rising and the trends are not sustainable.
- The “government” is heavily involved in medical spending.
- There is wide regional variation in spending per patient that is not related to patient outcomes.
In future posts I will offer some ideas about what could be done to restrain government spending on medical care and help solve the long term budgetary challenges associated with these spending trends. Believe it or not there is one federal program that is a relative model of efficiency. More on that later, but there are models out there that work.
The Future of Longevity
In several recent posts I have tried to provide some information about life expectancy and measures of public health that might inform the current debate on raising the eligibility age for Medicare and perhaps Social Security. These posts focused on some basic facts about longevity trends over the last 50 plus years. I also highlighted differences in life expectancy for men and women and also the influence of race and socioeconomic on life expectancy. Finally, I made the point that behavioral and other risk factors that operate throughout life need to be addressed if we want to narrow the effects of sex, race, and money on life expectancy. In this data heavy post I want to focus on the future of longevity and ask what this might look like going forward. One idea is that life expectancy is going to continue to rise, and the other idea is that as a result of the obesity epidemic and other factors it is going to flatten out.
What the US Social Security Administration says
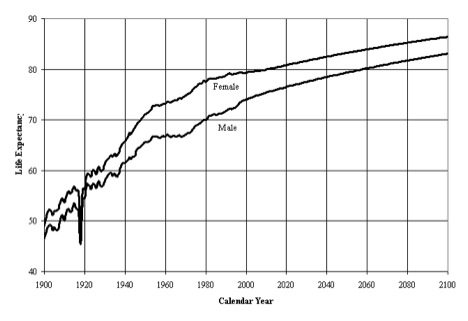
The next four figures are from the U.S. Social Security Administration (SSA) and might be described as the “official” estimates from 2005 for what might happen to life expectancy in the future. Here is a description of the first figure from the SSA report.
“The figure shows life expectancy at age 0, by sex and calendar year, based on period life tables. Rapid gains in life expectancy at age 0 occurred from 1900 through the mid 1950’s for both males and females. From the mid 1950’s through the early 1970’s, male life expectancy at age 0 remained level, while female life expectancy at age 0 increased moderately. During the 1970’s faster improvement resumed for both males and females. Life expectancy for males and females in the 1980’s improved only slightly with males improving more than females. In the 1990’s, life expectancy has remained fairly constant for females, increasing only slightly for males.”
The second figure is also from the same SSA report and shows trends and projections in life expectancy at age 65.

The third figure from the SSA report I want to show is about the age of the oldest of the old…….people who truly are one out of 100,000. For those interested in the topic of extreme aging here is a link to a list of the oldest lived people in history.
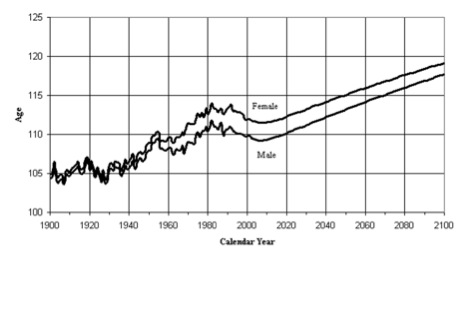
The final figure is comparative survival curves from 1900 to 2100. Here is a description of this figure from the SSA report.
“This figure presents the population survival curves based on period life tables for selected calendar years. Great strides were made in the twentieth century toward eliminating the hazards to survival which existed at the young ages in the early 1900’s. Very little additional improvement to survival rates is possible at these young ages. Survival rates at the older ages are projected to continue to improve steadily. Projected gains in the probability of surviving to age 90 during the next 50 years are about the same as experienced during the past 50 years. For age 100, projected gains are much greater than for the past. Figure 5 shows population survival curves based on period life tables for, from left to right, 1900, 1950, 2000 and projected years 2050 and 2100.
Although the shape of the survivorship curve has become somewhat more rectangular (less diagonal) through time, it appears that very little additional rectangularization will occur because survival rates are already so high at the young ages and are expected to continue increasing at older ages. The so-called “curve squaring” concept, though appealing to many, simply cannot be supported by the mathematics of mortality. The age at which the survivorship curve comes close to zero, through the compounding of single-year probabilities of survival, has increased greatly during the twentieth century and will continue to increase, as further strides are made against degenerative diseases. That mortality rates are found to continue to decline, at every age for which adequate data are available, demonstrates that no absolute limit to the biological life span for humans has yet been reached, and that such a limit is unlikely to exist.”

Looking past the Social Security data
As I noted in my introductory comments, there are two basic ideas about the future of longevity. The first idea is that life expectancy is going to continue to rise and that the curves above might be underestimating life expectancy in general and the fraction of people who make it to 100 or older in specific. If this occurs the public policy implications for the funding of and eligibility for Social Security and Medicare are problematic at best and a demographic time bomb at worst. Here is a quote from the article by Olshansky and colleagues:
“The cumulative outlays for Medicare and Social Security could be higher by $3.2 to $8.3 trillion relative to current government forecasts……….”
There are also concerns about the techniques used to make life expectancy forecasts for the Federal Government that might lead to underestimates over time. The second idea is that life expectancy is going to decline due to obesity and other factors. The people who take the position that life expectancy might fall are also concerned about the techniques used to make these forecasts and that they might lead to overestimates of projected changes in life expectancy.
Caveats & Conclusions about the future life expectancy and where this will lead
- Any changes in life expectancy are likely to be unequally distributed in the population at large. They are more likely to be seen in educated, well-connected better off people. Even in a country like Sweden where heroic steps have been taken to reduce health care disparities and inequalities, there are still health disparities and inequalities in life expectancy.
- The genetics of who makes it to 90 or 100 are not well understood and no obvious genetic markers that predict extreme old age have been identified. There is also some evidence that none will emerge with further research.
- My personal opinion is that trends in life expectancy will be divergent with some people trapped in a cycle of lifestyle related diseases and low social autonomy. There will be another group of long lived super guideline followers who will be generally well-educated and better off. These people will also be physically active, non-smokes, relatively normal weight, moderate drinkers, and engaged in life.
You are currently browsing the archives for the Health Policy category.
LIKE MIKE

SUBSCRIBE TO RSS
