
Archive for the ‘Research and Health’ Category
An Obesity Epidemic or an Inactivity Epidemic?
A few weeks ago I did a post that included 8 charts on how the U.S. got so obese.
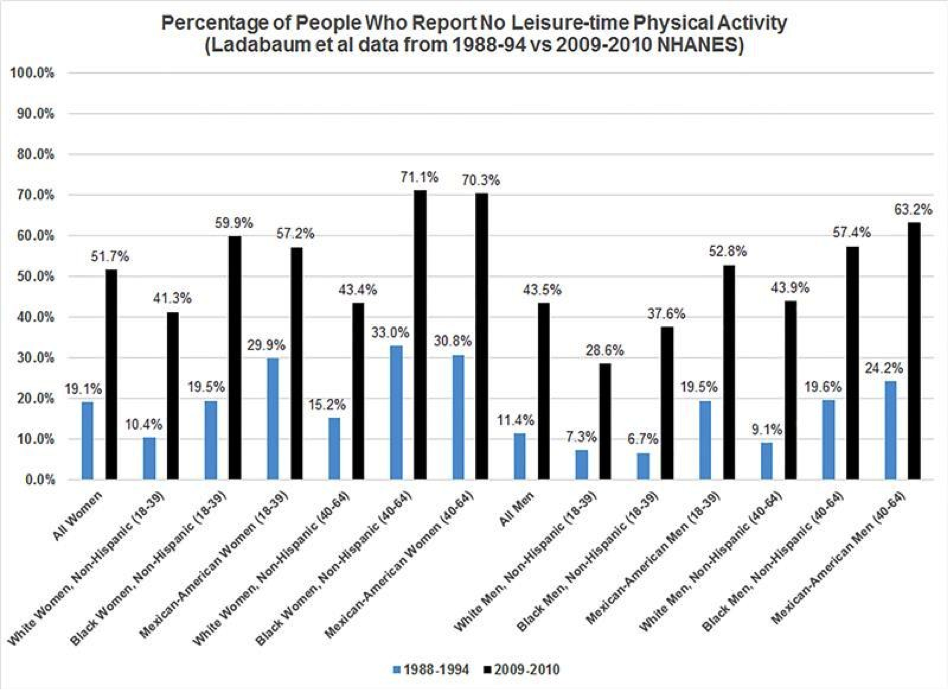
Below is a chart I missed from a paper published in early July. This study argues that less physical activity and not more calories is the primary cause of the obesity epidemic in the U.S. The black lines show the number of people who self-reported no leisure time physical activity in 2009-2010. The blue lines are the historical data from about 20 years ago. Twenty years ago about 19 percent of women and 11 percent of men got no leisure time physical activity. The more recent data shows that about 51% or women and about 44% of men get no leisure time physical activity. In essentially every demographic group there has been a 2-4 fold increase in inactivity over the last 20 years.
So do we have an obesity epidemic or an inactivity epidemic?

How the USA Got So Fat
You hear a lot of yapping about how the USA got so fat as a nation. All sorts of people want some simple reason for rise in obesity. That having been said, in the next eight charts I want to tell you a little bit about “what we know for sure” and see if I can paint a more complete picture of how this happened.
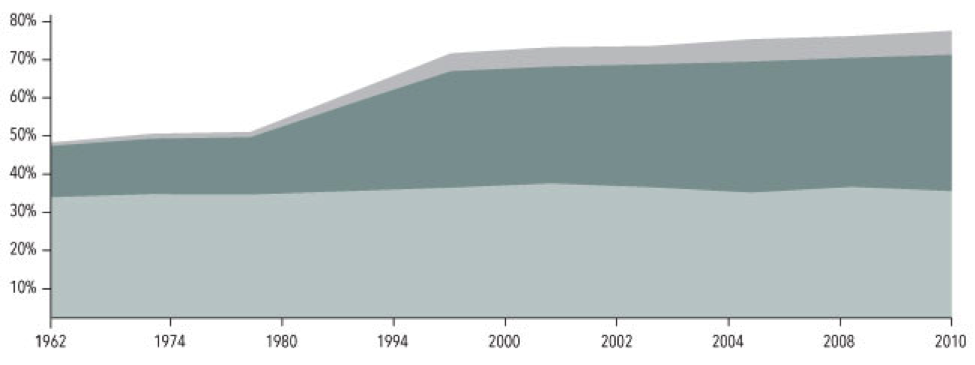
1. Obesity takes off in the late 70s.
The light grey bottom band on this chart from the NIH shows that the fraction of overweight American adults has been pretty constant at about 35% for years. The darker middle band shows that starting in the late 1970s the number of people who are obese has gone from about 10% to about 30%. The top band is the number of people with extreme obesity and it has gone from about 1% to about 6%!
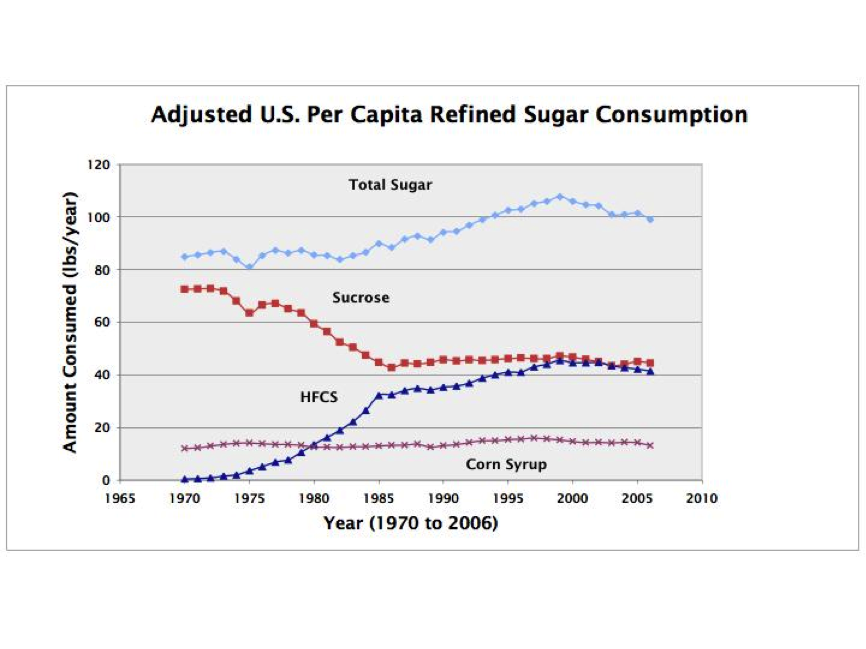
2. Sugar consumption takes off in the early 1980s.
Chart 2 shows that sugar consumption per person has increased from just over 80 pounds per year in 1980 to about 100 pounds per year or more over the last 20 years. Where we get this sugar from has changed too. Sucrose (table sugar) consumption has gone down and High Fructose Corn Sweetener (HFCS) has gone from essentially zero in 1970 to more than 40 pounds per year. This has led some people to label HFCS as the bogyman responsible for “all of this obesity”. A far bigger problem is probably just total sugar consumption.
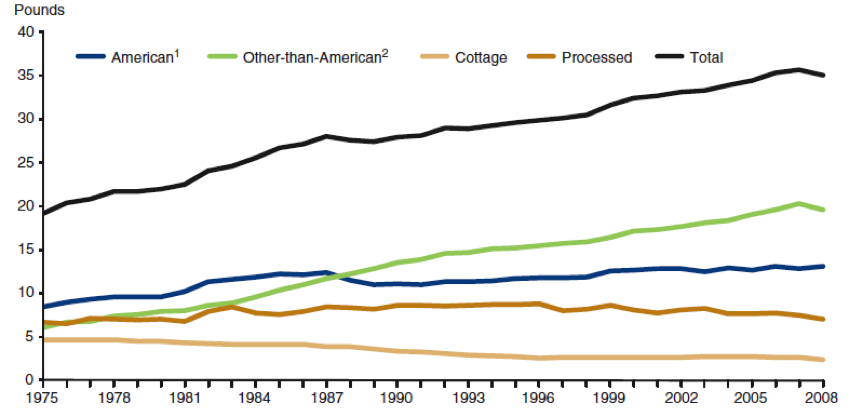
3. Cheese consumption has also skyrocketed.
Total cheese consumption as shown in chart 3 has also gone way up over the last 40 years. I am not sure what this means but just like sugar it is possible to construct a scenario where cheese is the culprit and “cause” of the obesity epidemic. A more plausible explanation is that the sugar and cheese consumption trends show what happens when agriculture policy is designed to generate a lot of tasty high calorie commodities that can then be turned into highly processed and convenient and low cost things to eat.
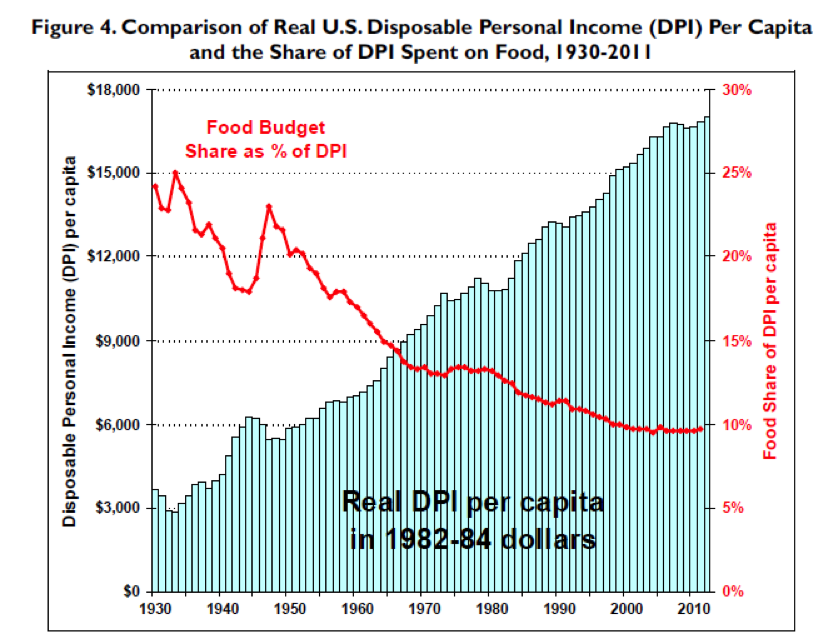
4. Cheap Food?
Chart 4 shows that the average person only spends about 10% of their disposable income on food. That is way down since 1930. The world does not get fat overnight or in just a year or two and the fact that spending on food went down so much in the 1950s and 60s might have set us up for the explosion of obesity that started in the late 70s. As I pointed out in the explanation of chart 3, this is another example of agriculture and food policy contributing to the problem.
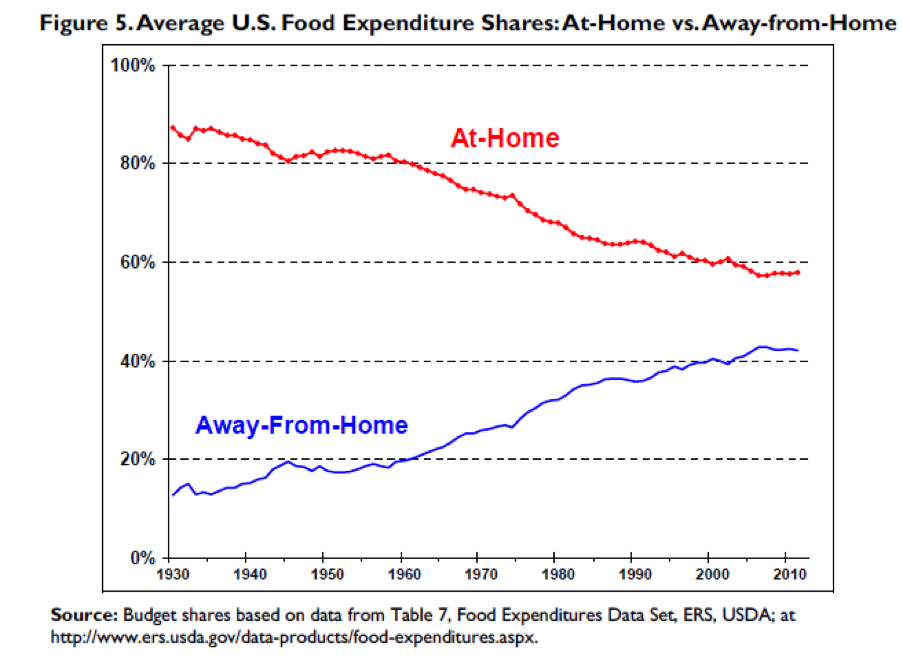
5. Eating Out?
Perhaps another result of “cheap food” ag policy and other changes in society like more mom’s working, people staying single longer, smaller families, and relentless marketing is that we eat far fewer meals at home than we used to as shown in chart 5. The people who sell us this food know how to pack the calories in and pack them in a way that keeps us coming back for more. The average person also typically underestimates the calorie content of the fast food they eat which amplifies the cheap food problem.
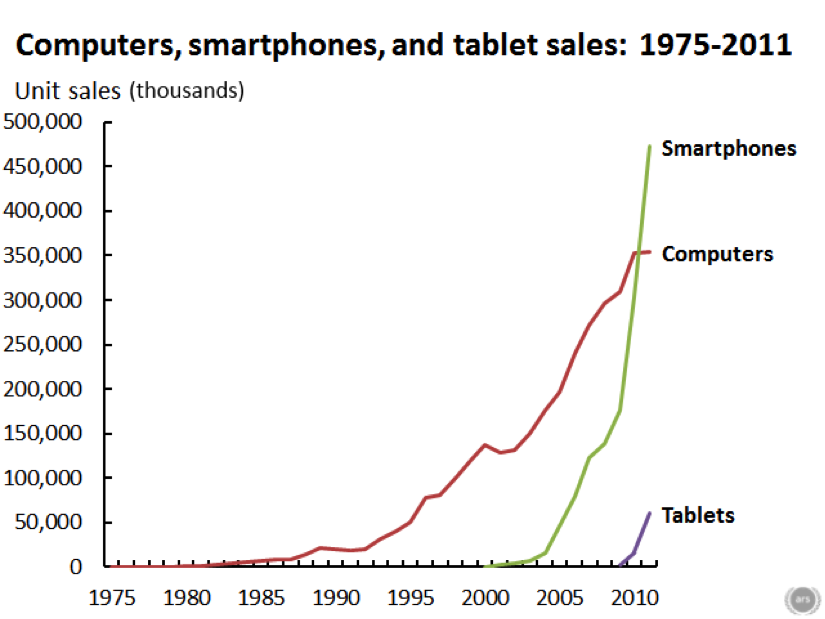
6. Screen time.
Chart 6 speaks for itself and is emblematic of the massive increase in screen time that we have all experienced since about 1980. Sitting in front of a screen can’t be good for your waistline.
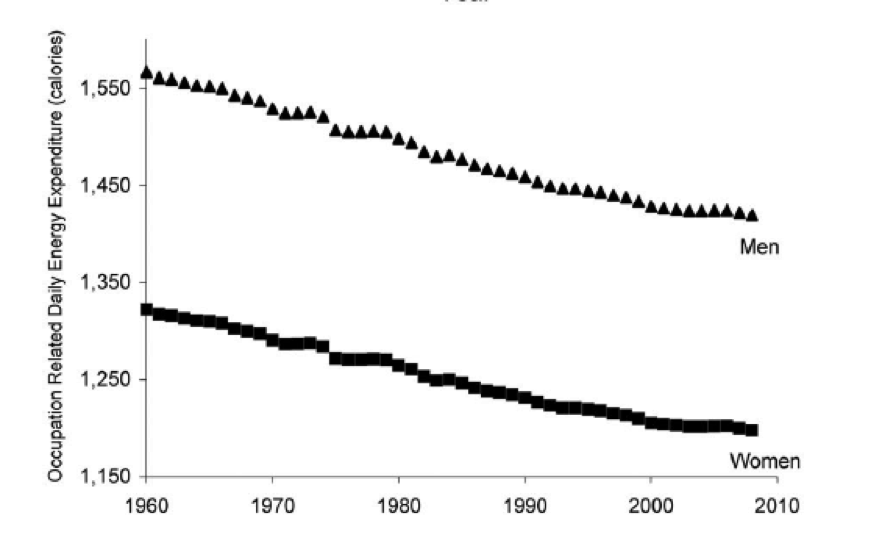
7. Occupational physical activity is way down.
Many people used to work at jobs that required either some or a lot of manual labor. Almost no one doses now, even the mailmen drive. Chart 7 shows that occupational physical activity is down by more than 100 calories per day for both men and women. This coupled with the fact that a lot of people get minimal or no recreational physical activity or exercise is another major problem. Some people have argued that the decline in occupational physical activity might explain most or the entire obesity epidemic.
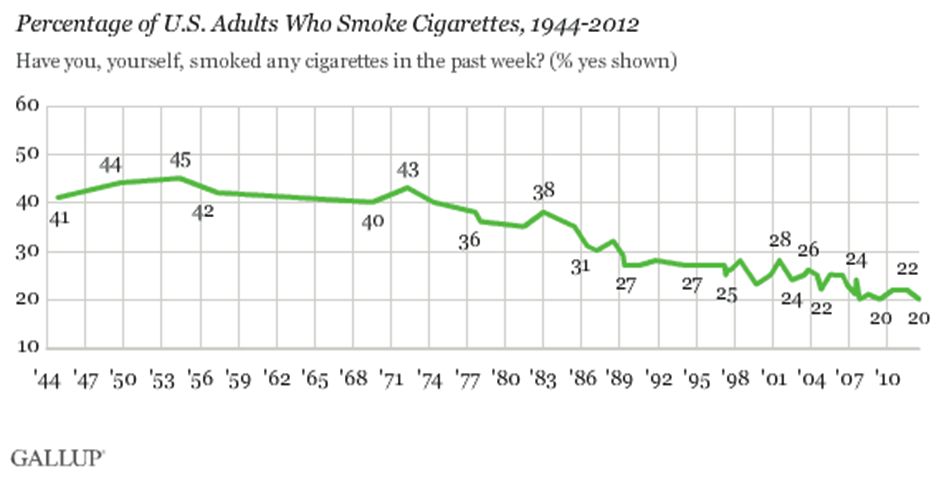
8. Smoking is down.
Smoking has also declined over the last 40 years and smokers tend to weigh less than non-smokers. So, one unintended consequence of the welcome reduction in smoking rates might be more obesity. This is a trade that most public health experts would gladly make except perhaps from people with extreme obesity. Just like sugar and/or cheese consumption, occupational physical activity, and screen time you can argue that less smoking “is responsible” for the obesity epidemic. But as I have tried to emphasize throughout this post, the cause is likely a combination of what we eat and less physical activity and not any “one thing”.
Closing Thoughts
The eight charts above are a sample of the many things that have likely contributed to the obesity epidemic. Thus, it is unlely there is any one explanation for the obesity epidemic and be suspicious of anyone who says there is. The charts also show that a multipronged approach will be required to turn the problem around. Changing food and agriculture policy and what we put in our collective mouths will be one part of any solution. Figuring out ways to get more of the population to build more physcial activity into their day will be the second part.
Big Science: Moonshots or Music?
The announcement in early June that the National Institutes of Health (NIH) was launching a 12 year 4.7 Billion dollar Initiative to study the brain caught my attention and spurred a bit of reflection about the NIH’s last big initiative – the Human Genome Project (HGP). We seem to be in an era of “Moonshot Science” and maybe it is time to ask how the clinical reality of the HGP has done compared to the original moonshot vision promulgated by its many advocates? Have we gotten to the clinical equivalent of the moon?
One of the main ideas behind the HGP was simple: if we know how the DNA based genetic code varies between people with and without certain diseases we will gain insight into the causes of disease. More importantly we can then screen for the genetic variants associated with diseases and offer pre-emptive and preventive interventions to those at greater risk. In some cases we might also be able to tailor drug therapy based on the individual’s genotype. For things like hypertension, heart disease, diabetes, obesity and some cancers this led to what has been termed the common-disease common-variant hypothesis.
At one level the HGP has been a massive test of the common-disease common-variant hypothesis. What are the results so far?
First, for most of the big killers in the developed world mentioned above, clear cut patterns of genetic risk have not emerged. Instead hundreds of genetic risk variants with very small effect sizes have been discovered and the distribution of these risky gene variants is the same in people with and without the disease of interest. Further, when information about these risky gene variants is plugged into risk prediction scoring systems commonly used by Drs, the predictive ability of the scoring systems do not get better. In fact for things like heart disease, diabetes, and hypertension simple knowledge of a patient’s height and waist size tells you far more about disease risk than genetics does.
Second, for common diseases the idea that we could get a gene test and then decide which drug is best for each patient is not working out as neatly as anticipated either. In fact for things like high cholesterol and high blood pressure the guidelines seem to be moving away from the idea that a specific drug might be picked for a specific patient based on genetics. For the commonly used blood thinner Warfarin, which can be tricky to dose, there was hope that information about the genetics of its metabolism would lead to better dosing algorithms, but unfortunately the clinical trials testing this idea failed.
Third, there is increasing evidence that it is difficult for both patients and providers to put information about genetic risk in context. Tell people they are at lower risk and some pay less attention to behavioral factors like diet and exercise that might help them prevent a variety of conditions. Tell them they are at increased risk and at least some get fatalistic and might also pay less attention to behavioral factors like diet and exercise that might help them prevent a variety of conditions. There is also evidence that the perception of increased risk can lead to more tests, biopsies and interventions which all cost money and at least some of them like preemptive surgery have their own set of risks.
Fourth, the HGP seems to have had the “side effect” of encouraging the development of animal models (mostly mice) where an engineered genetic variant leads to a predictable pattern of disease in the animals. This can then lead to the development of drugs that cure disease in animal models but fail clinical trials. One example is Alzheimer’s disease and the idea that it is all about amyloid. A number of anti-amyloid drugs work in the animal models designed to generate a buildup of amyloid in the brain, but twenty plus have failed clinical trials in humans. Additionally, there seems to be a disconnect between the reductionist ideas about amyloid as the cause of Alzheimer’s and the epidemiology data showing the major risk factors for Alzheimer’s include things like diabetes, hypertension, and physical inactivity. In some animal models, the disease of interest does not even show up if the animals are given access to minimal amounts of exercise.
So, based on the issues outlined above I would say some skepticism about moonshot biomedical science including the brain initiative is warranted. This skepticism also seems warranted because so many biomedical breakthroughs seem to be reverse examples of Yogi-Berra’s line about losing by making too many wrong mistakes. In medicine sometimes we win by making the right mistakes. A good example is the drugs that were designed to block the growth of blood vessels in tumors and “cure” cancer. Their effects on cancer have been modest but they have been vision saving in macular degeneration. Likewise drugs like Viagra started out as treatments for heart disease and their effects on erectile dysfunction were an unexpected and profitable surprise for the drug companies. The back story on Viagra is even more interesting because the fundamental observations ultimately responsible for the drug (which led to a Nobel Prize) were the result of a “mistake” made by a lab technician.
In the early 1970s the physiologist Julius Comroe and his anesthesiologist colleague Robert Dripps catalogued the 100 or so key discoveries needed to do then cutting-edge open heart surgery and concluded that about half of them happened by serendipity. Comroe and Dripps questioned the wisdom of too much goal directed big science just at the time the “war on cancer”, an even more dramatic metaphor than moonshot, was starting. As Gina Kolata reported in the Times in 2009, victory in that war is nowhere in sight.
However, there is hope. What the HGP has not revealed along with new ideas from the field evolutionary biology are leading to much more nuanced views of the role that DNA has in influencing the fate of animals including humans. These ideas are showing that DNA is not a simple read only code or program but that it operates in a way that can actually adapt to the environment. My colleague Denis Noble from Oxford has argued that the genetic code is in fact not a code at all but more like a musical keyboard that can be played by other parts of the body and even the environment, behavior and culture. So perhaps we need to stop thinking about biomedical problems as moonshots or wars and more like music. With that mindset maybe we can get to the “right mistakes” generated by all of this big science and find the clinical insights a little bit faster.
Dick Fosbury vs. Guidelines
Over the past couple of years I have argued that the current world wide obsession with “big data” and metrics is going to lead all sorts of people astray in many fields. The related idea is that every human activity can be turned into a quality improvement project with guidelines and check boxes that will reduce error and improve outcomes. Taken too far these twin beliefs are going to limit the sort of individual mastery and innovation needed to find novel solutions to our problems.
A couple of months ago I gave a presentation at Mayo where I highlighted the problems of too much standardization in medicine and the risk it poses to better patient care and innovation. I used parallels with the high jumpers Dick Fosbury and Debbie Brill who as teenagers in the 1960s invented the ‘flop’ and went over the bar backwards. In the current world would their efforts have been stifled by a compliance bureaucracy insisting they face the high jump bar while going over? What would the “approval process” for this new technique be in 2014? How many other barriers might be thrown up in the current world to stop them from moving high jumping forward by going backwards?
I explore these and related issues in the talk below. It is a long presentation about 40 minutes, but bear with me and I think you will enjoy the questions and observations raised in the talk.
Old and Unexciting Exercise Solutions
Last weekend in the Sunday Review section of the New York Times, Daniel Duane provided a personal narrative about how he adopted an old school and trainerless approach to weight lifting and essentially “got in shape” in his early 40s. This raises questions about what is old and unexciting in the field of exercise.
Consistency and progression matter.
The first thing you notice about all effective fitness programs is that consistency matters. People who get in better shape exercise regularly. After people start to get in shape the ones who get in better shape have a progressive program. In other words, as they get stronger they lift heavier weights, or as their endurance improves they run faster and farther. The before and after testimonial pictures seen on websites and infomercials all feature people who have actually done the program.
A couple of years ago the author and radio personality Peter Sagal wanted to improve his marathon time and he describes the advice I gave him:
I laid out my vitals for Dr. Joyner–5′ 7″, 175 pounds, 20 to 25 miles of running a week–and he expressed his wisdom simply and brutally: If I wanted to bend the arc of my performance back upward, I’d have to (A) run more, (B) lose weight, and (C) run a lot more. Joyner’s research showed that slowing the ravages of time was possible, but only with intense effort.
It worked and he set a personal record of 3:09 in his later 40s.
High Intensity Training (HIT) is an old idea.
I am not sure how many waves of enthusiasm there have been for HIT over the last 100 years. However, one of the most notable was promulgated in the 1970s by a serial innovator and promoter named Arthur Jones who developed Nautilus Machines. Read what he wrote in the 1970s and ask yourself what is new? For those interested in HIT and endurance, the training of Glenn Cunningham who held world record holder in the mile (4:06.8) during the middle 1930s anticipates current programs by about 80 years.
Calisthenics work!
In the late 1950s, the Royal Canadian Air Force got concerned about the poor physical fitness of pilots stationed in isolated bases in the far north with limited fitness facilities. To solve this problem RCAF developed a simple program of five basic exercises (5BX) that worked and could be done in 11 minutes per day. The program also encouraged people to build as much physical activity into their days as possible. A CBC radio interview with Wing Commander J.K. Tett of the RCAF from sometime in the 1960s emphasizes guess what, the role of consistency and progression in making the plan work.
The pull-up program used by many members of the U.S. Marine Corps to score well on the Marine fitness test is another example of what is possible with a simple, consistent and progressive approach to training. When people ask me about strength training I tell them when in doubt do push-ups, pull-ups and burpees.
Complicating the simple?
So, why the drive complicate the simple? In an e-mail exchange on the Duane story, Amby Burfoot the winner of the 1968 marathon commented that he was:
…struck by the comment about trainers who have an investment in making their advice as complex and lingo-heavy as possible. I’ve thought this for a long time, and of course practiced it as editor of a magazine that had accountants looking over my shoulder….. we need a term for this. I was thinking educate vs complexicate but that doesn’t include the important financial angle. The definition would be ‘make a subject as complicated and lingo-driven as possible in an effort to enhance one’s seeming knowledge and financial value as an “expert’ teacher in the field’…….
I think Amby is onto something and in addition to fitness, efforts to complexicate things are also at work for conceptually simple things like weight loss and healthy aging. My guess is that similar efforts to complexicate also drive the culture of consultants who offer advice to clients in many fields, but I will leave that to economists, social scientists and management gurus to explain. Can they do it in plain language in less than 1,000 words?
The Life Expectancy Gap & Income
I have done a number of posts on the influence of income and eduction on life expectancy. This topic will get more and traction as discussion about raising the retirement age accelerates due to the demographic pressure on programs like Social Security and Medicare. If the retirement age is raised, the argument is that it will unfairly penalize people with lower incomes.
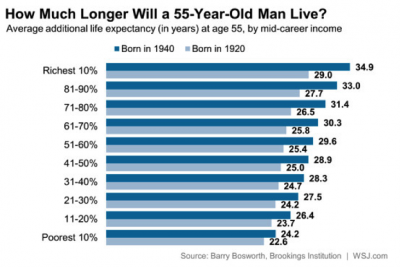
New Data on Income vs Life Expectancy
The graphics below are some new estimates by the Brookings Institution published in the Wall Street Journal that show the effects of income on life expectancy. The data show that better off people live longer and that this wealth effect is increasing for people born in 1940 vs. 1920. Life expectancy is actually getting worse for poor white women!

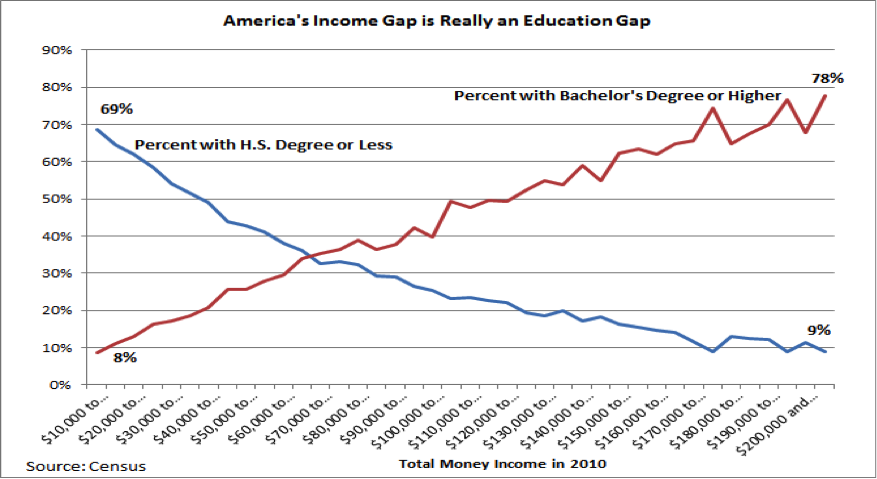
Education & Income
The graph below from the Tax Foundation shows that for the purposes of the sorts of population based comparisons I am making in this post, that education and income are essentially the same thing. This will become important as I try to factor out just how much of the life expectancy income/education gap is about money or perhaps other factors. If you use this graph and extrapolate the income and education data people without high school educations live 10 or more years less than those with bachelor’s degrees or higher. That is about what the life expectancy difference looks like when the top and bottom 10 or 20% of incomes are compared.
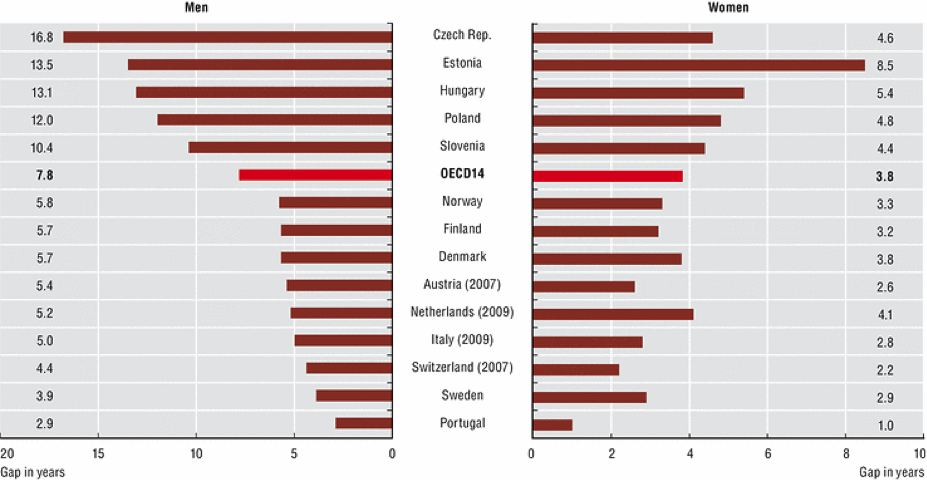
What About Sweden?
Sweden is a country that has done all it can to reduce and modulate the effects of social and economic inequality on its population. So are there life expectancy differences by income or education in Sweden? The graph below shows the data for a number of countries in Europe including Sweden. The individuals in top 25% of educational attainment (essentially college or more) are being compared to the individuals who did not finish high school. In Sweden the most educated men live about 4 years longer and the Women live about 3 years longer than their least educated counterparts. If you compare this to the differences between the top and bottom 10-20% of incomes in the US the differences are about 7 years for men and 8 for women. This number for men in the US is similar to the average value for OECD 14 countries but the gap for women in the U.S. is much higher.
The Persistent Gap
The point of all of this is that there is an income/education/life expectancy gap and even the social democracies of Northern Europe can’t make it go away. What is interesting is that like the US, smoking and other negative health behaviors are generally lower in well off and better educated people in this part of the world.
“The prevalence of smoking was higher in Denmark compared to Sweden. The total attributable fraction (TAF) of low education regarding daily smoking was 36% for Danish men and 35% for Danish women, and 32% and 46%, respectively, for Swedish men and women. TAF of low education regarding continued smoking were 16.2% and 15.8% for Danish men and women, and 11.0% and 18.8% for Swedish men and women, respectively”
The statistics in the paper above are a bit obscure but in the U.S. smoking and inactivity rates are typically higher by 2-4 times or more in the least vs. most educated and well off people.
Take Home Messages & Thoughts
- When I try to integrate the data above for men it seems to me that perhaps 30-40% of the life expectancy gap in the U.S. is due to general economic insecurity and things like lack of health care. However, a gap persists in countries where these concerns are not nearly as dramatic as they are in the U.S. However, like the U.S., there are education and income related differences for things like smoking just about everywhere.
- For women, it is worse in the U.S. and appears to be headed in the wrong direction. My guess is that women, especially poor women, are now participating in unhealthy behaviors as social taboos against smoking for example have faded.
- I remain an advocate of sin taxes.
- Education leads to income and to get educated you have to have infrastructure at home when and you have to develop some impulse control and ability to “self-regulate” early in life. I am not sure how to make this work from a policy perspective, but it is pretty clear that intensive early childhood interventions for poor kids can make a huge difference in terms of educational achievement, income and later health.
“High-quality early childhood programs have been shown to have substantial benefits in reducing crime, raising earnings, and promoting education. Much less is known about their benefits for adult health. We report on the long-term health effects of one of the oldest and most heavily cited early childhood interventions with long-term follow-up evaluated by the method of randomization: the Carolina Abecedarian Project (ABC). Using recently collected biomedical data, we find that disadvantaged children randomly assigned to treatment have significantly lower prevalence of risk factors for cardiovascular and metabolic diseases in their mid-30s. The evidence is especially strong for males. The mean systolic blood pressure among the control males is 143 millimeters of mercury (mm Hg), whereas it is only 126 mm Hg among the treated. One in four males in the control group is affected by metabolic syndrome, whereas none in the treatment group are affected. To reach these conclusions, we address several statistical challenges. We use exact permutation tests to account for small sample sizes and conduct a parallel bootstrap confidence interval analysis to confirm the permutation analysis. We adjust inference to account for the multiple hypotheses tested and for nonrandom attrition. Our evidence shows the potential of early life interventions for preventing disease and promoting health.”
- I generally have a libertarian perspective on things like legalizing and taxing marijuana, however I am not sure if this will help solve the problem of people getting left behind in the education, income and ultimately health race.
- Finally, when people tell you that raising the retirement age is unfair to people who make less money, tell them to channel Jack Kemp, because what the poor need is a way out of poverty.
Is Talent Genetic?
I have done a couple of recent posts on the idea that practice (the so-called 10,000 hour rule) is more important than talent in reaching elite levels of performance. The main conclusion from all of this is that practice can make most people really good at most things but talent (and also exposure to given activity) are required for truly exceptional levels of performance. When the topic of talent comes up the assumption is that it is inherited from our parents and other ancestors. This then leads to the idea that talent is genetic and that eventually genes that confer the chance for exceptional performance are out there waiting to be identified.
You can take the same general line of reasoning and apply it to things like height, weight, or even your risk of getting certain diseases like high blood pressure and diabetes that tend to “run in families”.
Let’s Start With Darwin
Charles Darwin’s ideas pre-date the concept of genes. He made lots of observations about how animals vary from place to place and adapt to their environment. One of fundamental ideas is that via the process of natural selection, animals and plants best suited to their environment are more likely to survive and reproduce. This reproductive success is dependent on the transmission of key characteristics to the offspring which increase their odds of survival. When this happens generation after generation certain composite traits called phenotypes emerge.
Galton is Next
After Darwin, his cousin Francis Galton came along and started to make statistical estimates of heritability for things like height and intelligence. His observations showed a strong correlation between parents and offspring for many phenotypes and he commented that:
“I have no patience with the hypothesis occasionally expressed, and often implied, especially in tales written to teach children to be good, that babies are born pretty much alike, and that the sole agencies in creating differences between boy and boy, and man and man, are steady application and moral effort. It is in the most unqualified manner that I object to pretensions of natural equality. The experiences of the nursery, the school, the University, and of professional careers, are a chain of proofs to the contrary.”
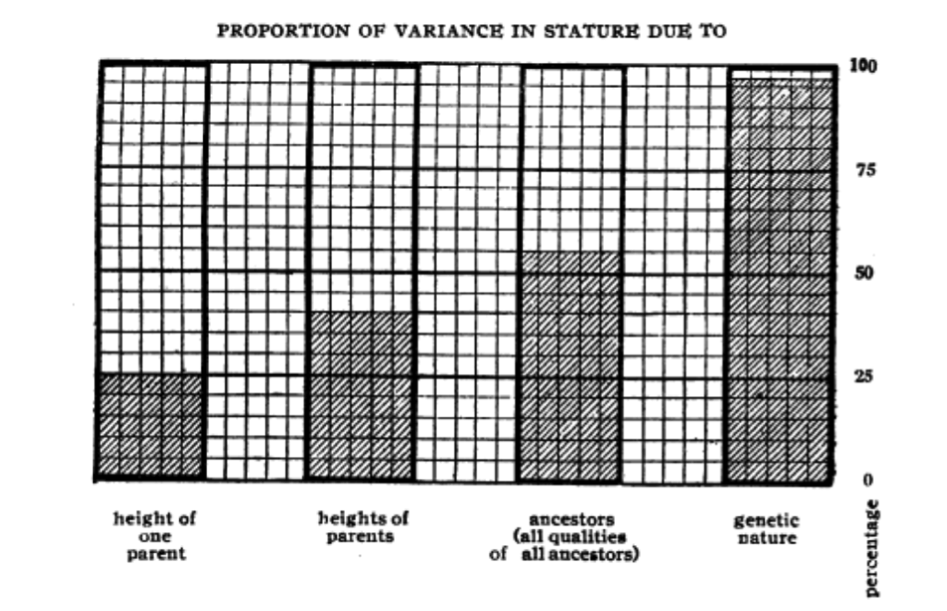
Galton’s statistical work was later extended and amplified by Pearson and Fisher who are familiar to anyone who has ever taken a basic statistics class. The figure below is from a paper by Fisher in 1919 showing his estimates of how height was inherited from parents and earlier ancestors.
The First Version of Genes
About the same time that the statisticians got busy the work of Gregor Mendel was rediscovered. Mendel did breeding experiments with peas of different phenotypes and showed via so-called “laws of inheritance” how the various characteristics were transmitted from generation to generation. None of his observations could be explained in a satisfactory way by earlier ideas about how phenotypes were transmitted from generation to generation. In about 1909 Wilhelm Johannsen came up with the idea of both genotype and phenotype and:
“Johannsen’s most notable experiments concerned his so-called ‘pure lines’ of the self-fertile princess bean, Phaseolus vulgaris. Studying the progeny of self-fertilized plants, he selected the character of bean weight and found that both the lightest and the heaviest beans produced progeny with the same distribution of bean weights, i e they were genetically identical. He concluded that the variations in bean weight were due to environmental factors and he introduced the terms genotype (for the genetic constitution of an organism) and phenotype (for the characteristics of an organism that result from the interaction of its genotype with the environment). Johannsen favoured the view of de Vries that inheritance was determined by discrete particulate elements and abbreviated de Vries’s term ‘pangenes’ to ‘genes’.”
In this view we have the idea that genotype = phenotype with some modification by the environment. It also explains why Fisher assumed his estimates of the heritability of height could be explained by this early definition of “what is a gene”.
Genes and Evolution
The ideas about the statistics of heritability, genes and the fossil record were then integrated in the 1930s and 40s into something called the “Modern Synthesis” of evolutionary biology:
“The synthesis, produced between 1936 and 1947, reflects the consensus about how evolution proceeds. The previous development of population genetics, between 1918 and 1932, was a stimulus, as it showed that Mendelian genetics was consistent with natural selection and gradual evolution. The synthesis is still, to a large extent, the current paradigm in evolutionary biology.”
The Changing Definition of a Gene
What happens next is that DNA is discovered and the more general version of a gene is replaced by one based on the idea that DNA is a “read only” genetic code and that has been oversimplified to infer that DNA = phenotype. There is actually something called the “Central Dogma of Molecular Biology” that has been perhaps unwittingly over extrapolated to infer that DNA=phenotype. The term “Central Dogma” also has a strangely medieval religious ring to it.
However, it turns out that the genome and the products coming from it are subject to all sorts of environmental influences and that the idea of a linear – one way street – transfer of information from gene to protein to phenotype is a gross over simplification. There is even evidence that acquired characteristics can be inherited. These newer ideas about what might be described as a more flexible genome also explain why it has been so hard to find discrete DNA snippets that fully or even mostly explain many things including the statistical estimates of heritability exceptional longevity, height, BMI, intelligence and the risk for many common diseases.
For those of you who want to take a deep dive into these issues the link below is to a lecture by Denis Noble who has argued for a far more nuanced view of how genetic information is converted into phenotypes and how this influences how phenotypes are inherited from one generation to the next.
http://youtu.be/k3x6vlJMbk0
Back to Talent
Many human characteristics including things that might be called talent have a high statistical probability of being inherited from our parents and ancestors. When the pre DNA definition of gene is used, then it is pretty easy to think about a sort of non-specific genetic explanation for them. However, when the DNA based definition of a gene is used it is hard to find discrete or obvious DNA based genetic explanations for most things. So, don’t expect a blood test anytime soon that is going to tell you that your kids are can’t miss at anything, and even if they have all the “genetic” talent in the world will they get exposed to what they might be great at and will they be willing to practice both intelligently and relentlessly? The author Aldous Huxley (Brave New World) who comes from a long multi-generation family line of exceptional achievers said:
“There is no substitute for talent. Industry and all its virtues are of no avail.”
On the other hand a standard concept from the sporting world is that you “can’t coach desire”.
Perhaps the truly elite performer in any endeavor needs to have it both ways.
Supplements: To Take or Not to Take?
There are a large number of vitamins and other supplements that are purported to improve metabolic health, cardiovascular risk and perhaps have anti-aging effects. The idea is that is that these products do things like lower blood pressure, improve blood lipids, and reduce the risk of diabetes. The consumer market for these products is huge with about 27 billion dollars spent in the U.S. during 2009.
Do They Work?
There are a couple of ways to answer the do they work question. The first way is to survey the population and see what the health of users and non-users looks like. When this was done in about 300 multiple supplement compared to about 600 non-users, the supplement users came out ahead for many variables associated with better long term health.
Dietary supplements consumed on a daily basis by more than 50% of Multiple Supplement users included a multivitamin/mineral, B-complex, vitamin C, carotenoids, vitamin E, calcium with vitamin D, omega-3 fatty acids, flavonoids, lecithin, alfalfa, coenzyme Q10 with resveratrol, glucosamine, and a herbal immune supplement. The majority of women also consumed gamma linolenic acid and a probiotic supplement, whereas men also consumed zinc, garlic, saw palmetto, and a soy protein supplement……After adjustment for age, gender, income, education and body mass index, greater degree of supplement use was associated with more favorable concentrations of serum homocysteine, C-reactive protein, high-density lipoprotein cholesterol, and triglycerides, as well as lower risk of prevalent elevated blood pressure and diabetes.
Pretty convincing, except who knows what other health behaviors the supplement users were engaging in. For example, they might have been exercising more or eating a generally healthier diet than non-users.
So, what happens to the blood pressure, lipids and glucose levels to matched groups of people given multiple supplements prospectively? Do they make a difference? When about 60 generally healthy middle aged men and women were randomized to receiving either a standard multivitamin or a multivitamin and supplement cocktail containing resveratrol, quercetin, carnitine, alpha-lipoic acid, curcumin, pomegranate extract, fish oil, cinnamon bark, green/white/black tea complex and sesamin:
“The main outcome measures were arterial stiffness, endothelial function, biomarkers of inflammation and oxidative stress, and cardiometabolic risk factors. Twenty-four weeks of daily supplementation with 10 dietary supplements did not affect arterial stiffness or endothelial function in nonobese individuals. These compounds also did not alter body fat measured by DEXA, blood pressure, plasma lipids, glucose, insulin, IGF-1, and markers of inflammation and oxidative stress. In summary, supplementation with a combination of popular dietary supplements has no cardiovascular or metabolic effects in non-obese relatively healthy individuals.”
What About Vitamins?
The data on vitamins is generally worse. At least one analysis that has evaluated all of the studies on vitamin E supplementation suggests that relatively high doses might increase all-cause mortality. Others have concluded that there is likely no effect. There might also be issues with vitamin A. When the effects of vitamin C and vitamin E on longevity and lifespan are evaluated in “model organisms” like fruit flies and rodents, the data is all over the place. Here is a summary for the vitamin E studies:
Twenty-four studies were included in the final analysis. While some studies suggest an increase in lifespan due to vitamin E, other studies did not observe any vitamin E-mediated changes in lifespan in model organisms. Furthermore there are several studies reporting a decrease in lifespan in response to vitamin E supplementation. Different outcomes between studies may be partly related to species-specific differences, differences in vitamin E concentrations and the vitamin E congeners administered. The findings of our literature review suggest that there is no consistent beneficial effect of vitamin E on lifespan in model organisms which is consistent with reports in human intervention studies.
To Take or Not To Take?
Based on the summaries above, it is hard to make a convincing argument that anyone without evidences of a primary vitamin deficiency should be taking vitamins. This is especially true if your diet is high in fruits, veggies, “good fat” and you are physically active. Pretty much everything vitamins and supplements are supposed to fix can be optimized with a reasonable diet and plenty of exercise.
You are currently browsing the archives for the Research and Health category.
LIKE MIKE

SUBSCRIBE TO RSS
