
What Happens if Life Expectancy Keeps Rising?
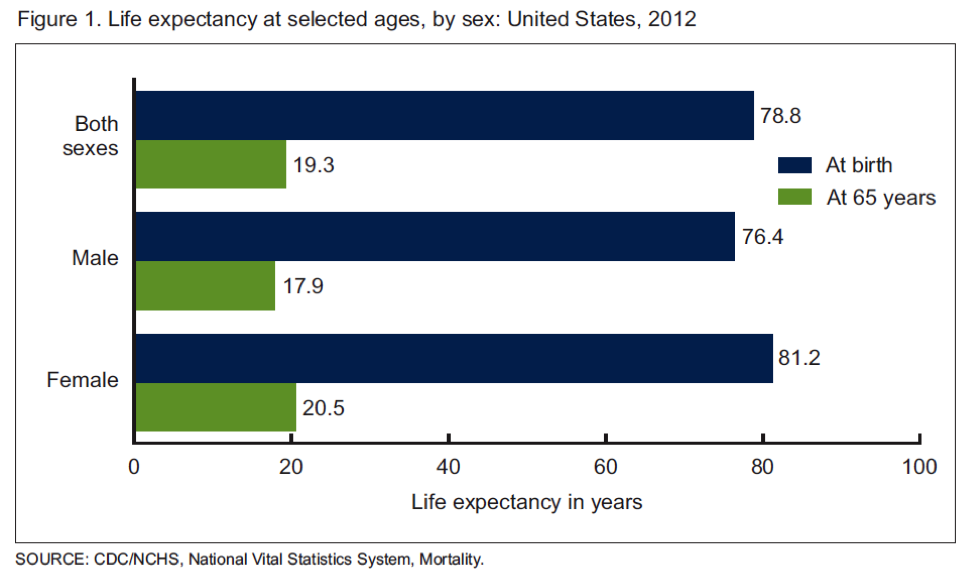
The US Centers for Disease Control (CDC) recently released its annual report on life expectancy. The data covers 2012 and show life expectancy continuing to rise in the US. The chart below is the current data and the overall average is a little over a month higher than the estimate for 2011. Additionally, there were gains in most ethnic subgroups. The green bars in the chart also show that the average person who makes it to 65 will likely live another 19 plus years. That number is also trending upwards.
US Life Expectancy Still “Low”
Life expectancy is still relatively low in the US compared to other rich countries with numbers in the low 80s. The reasons for this are complex and center on issues primarily related to economics, behavior, and to a lesser extent access to medical care. The chart below is from an excellent 2007 report from the Social Security Administration, it shows that for men life expectancy at age 65 is going up faster for those in the top half of income compared to the bottom.
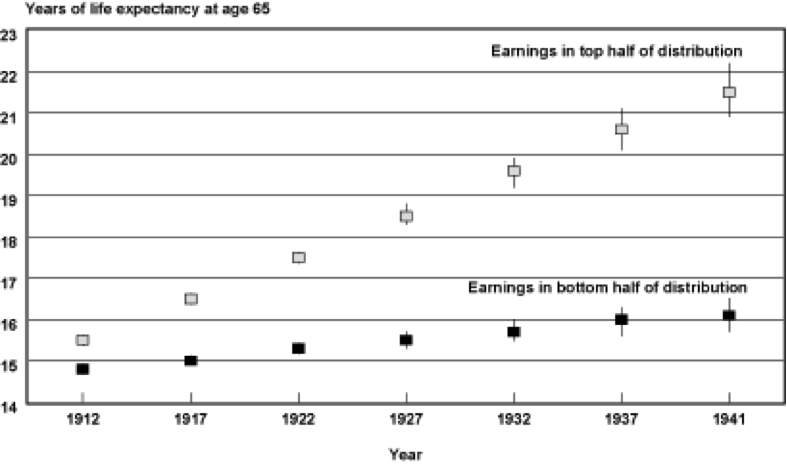
For example for men born in 1912 both groups could expect to live about 15 more years. For those born in 1941 those in the lower half could only expect 16 years of additional life compared to their better off counterparts could expect about 21 years of additional life.
How High Can Life Expectancy Go?
In previous posts I have tried to dissect out how much of some of these life expectancy gaps are due to things like differences in health behaviors and or economics. If life expectancy for people who are less well off “catches up” with the numbers for the better off it could have major implications for the overall number. There was also a great longer article in the Atlantic about the implications of a population wide life expectancy of 100. The article also highlighted a debate in the epidemiology community. Some people see life expectancy continuing to rise while others see it flattening out somewhere in the 80s. There is also some speculation that it might decline due to the obesity epidemic and a rise in diseases like diabetes. The next chart is from a classic 1990 paper and shows what happens to life expectancy at age 50 for both men and women if cancer, cardiovascular disease and diabetes are eliminated. Life expectancy rises but tops out at 90 for men and 96 for women.
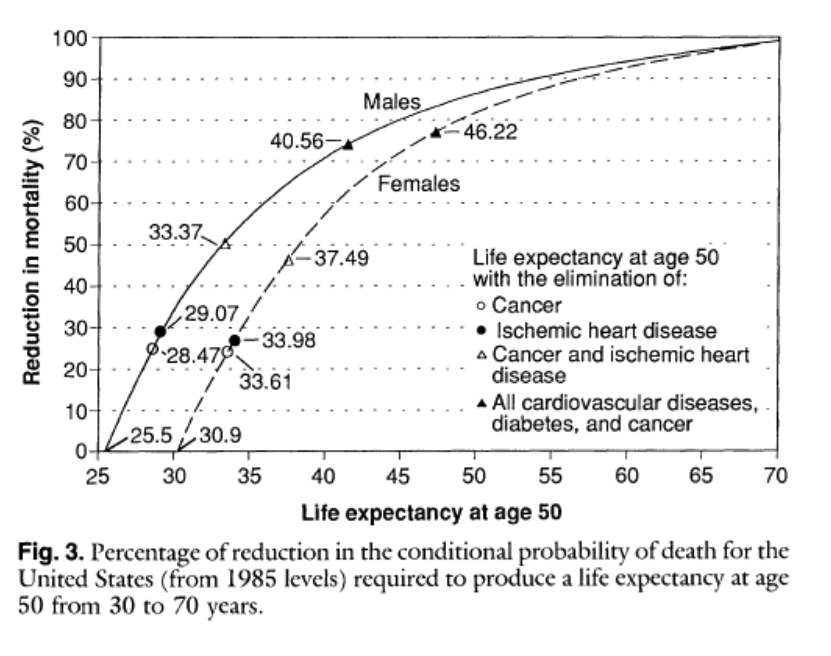
This type of analysis argues that while life expectancy might continue to rise, it is not going to get 100 anytime soon without the development of some sort of magic bullet anti-aging therapy. It is also interesting to note that populations of “guideline followers” who don’t smoke, exercise, don’t get fat etc. frequently live to about 90.
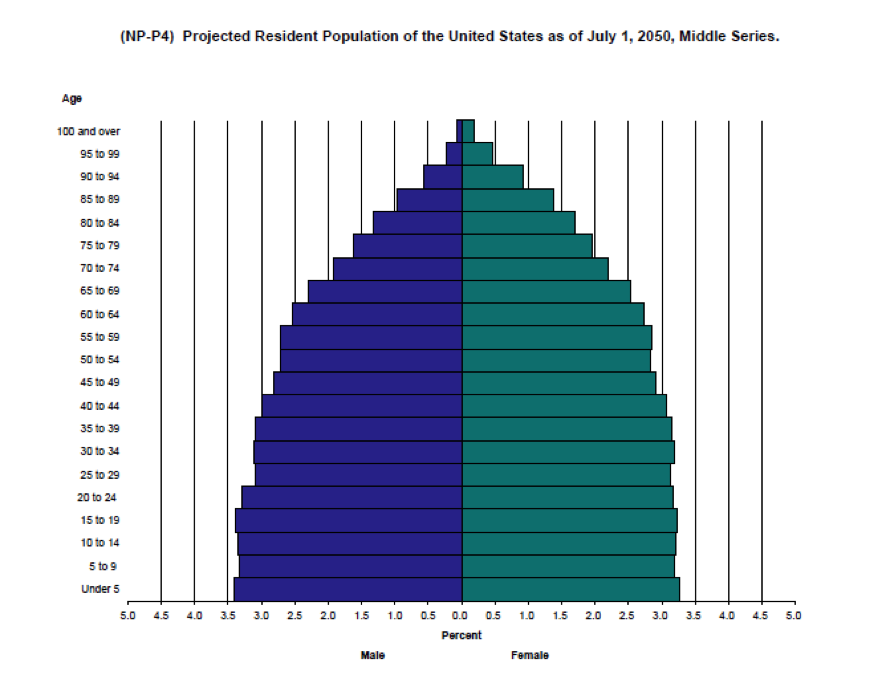
Structure of Society
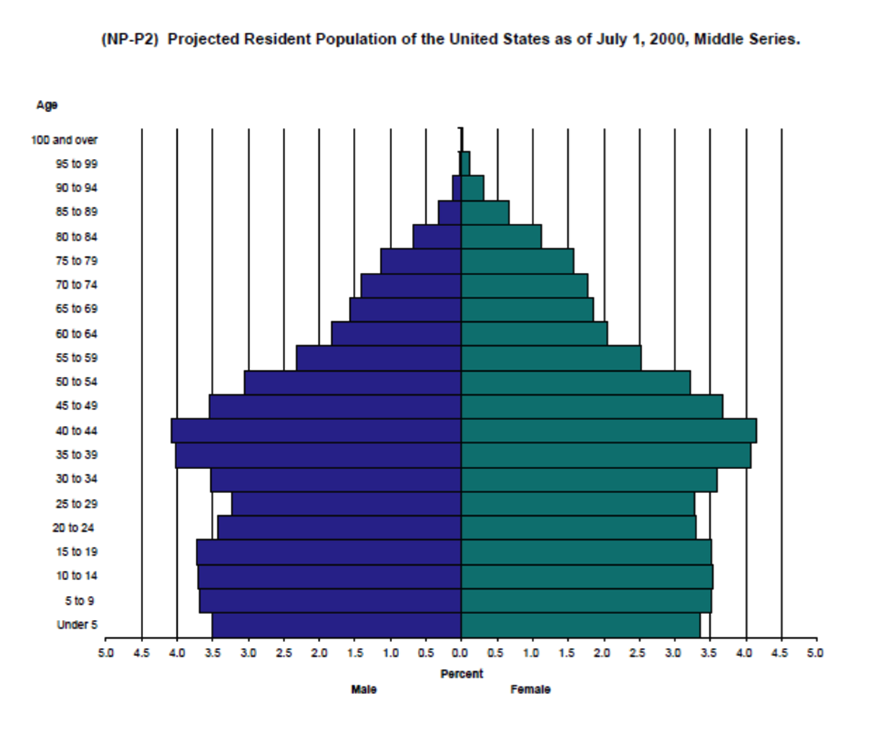
The next two charts are “population pyramids” for the US. The first is for 2000 and the second is an estimate for 2050. As life expectancy increases and the average woman has fewer children the population will age.
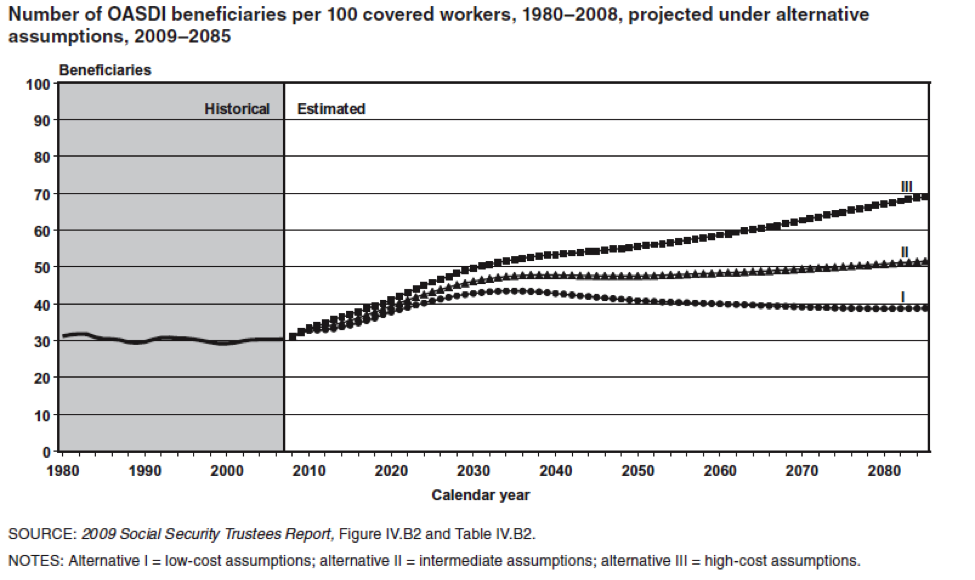
The key point is that there are going to be a whole lot more old people that there used to be and the next chart shows the implications for this in terms of the number of workers to retirees. Today there are about 35 people receiving Social Security benefits for every 100 workers. In 2050 that number will be about 50 per 100 or perhaps as high as about 55 per hundred. Some version of these ratios will ultimately affect all programs directed at our aging population.
Something Has Got To Give
As a result of the aging population, the long term implications of programs like Social Security and Medicare on the US Federal Budget have been well known for many years. There has been some recent good news on the economic front in terms of the relative robustness of the US economic recovery compared to historical trends for recoveries after financial meltdowns. Additionally, health care spending has moderated and there is some positive news on the federal debt. All of this has provided the President and Congress with a window of opportunity to address some of the fundamental issues associated with an aging population. However, for Social Security and Medicare none of the choices will be “fun” for political decision makers because solutions include things like:
- Raising the retirement age
- Cutting or restructuring benefits
- Raising taxes
Given the gridlock in Washington, my personal bet is that nothing will happen until the later 2020s when the problem of how to finance social programs for an aging population becomes more acute as a result of increasing Federal debt and concerns about the solvency of the trust funds linked to the programs. Coming up with long terms solutions sooner rather than later would surely be less painful in the long run. However, I don’t expect any sudden outbreaks of either the political courage or the negotiating skills needed to address the fiscal challenges of an aging population until there is a crisis.

Tags: life expectancy
This entry was posted on Monday, October 13th, 2014 at 4:17 am and is filed under Current Events, Health Policy. You can follow any responses to this entry through the RSS 2.0 feed. You can leave a response, or trackback from your own site.
2 Responses to “What Happens if Life Expectancy Keeps Rising?”
Leave a Reply
LIKE MIKE

SUBSCRIBE TO RSS

October 14th, 2014 at 8:32 am
How much of the difference between the life expectancy for high eraner vs low earner is explain by the proportion of smoker in each group?
October 20th, 2014 at 5:37 am
Daniel, here are some older posts on related topics, my guess is that 50% of more of the gap is health behaviors.
http://www.drmichaeljoyner.com/life-expectancy-entitlements-economic-inequality-or-behavioral-inequality/
http://www.drmichaeljoyner.com/the-politics-of-life-expectancy-lifestyle/
http://www.drmichaeljoyner.com/tag/life-expectancy-gap/