
How the USA Got So Fat
You hear a lot of yapping about how the USA got so fat as a nation. All sorts of people want some simple reason for rise in obesity. That having been said, in the next eight charts I want to tell you a little bit about “what we know for sure” and see if I can paint a more complete picture of how this happened.
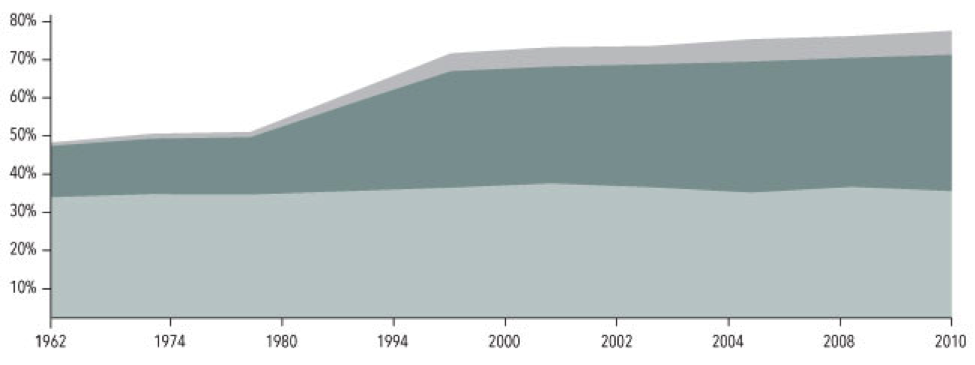
1. Obesity takes off in the late 70s.
The light grey bottom band on this chart from the NIH shows that the fraction of overweight American adults has been pretty constant at about 35% for years. The darker middle band shows that starting in the late 1970s the number of people who are obese has gone from about 10% to about 30%. The top band is the number of people with extreme obesity and it has gone from about 1% to about 6%!
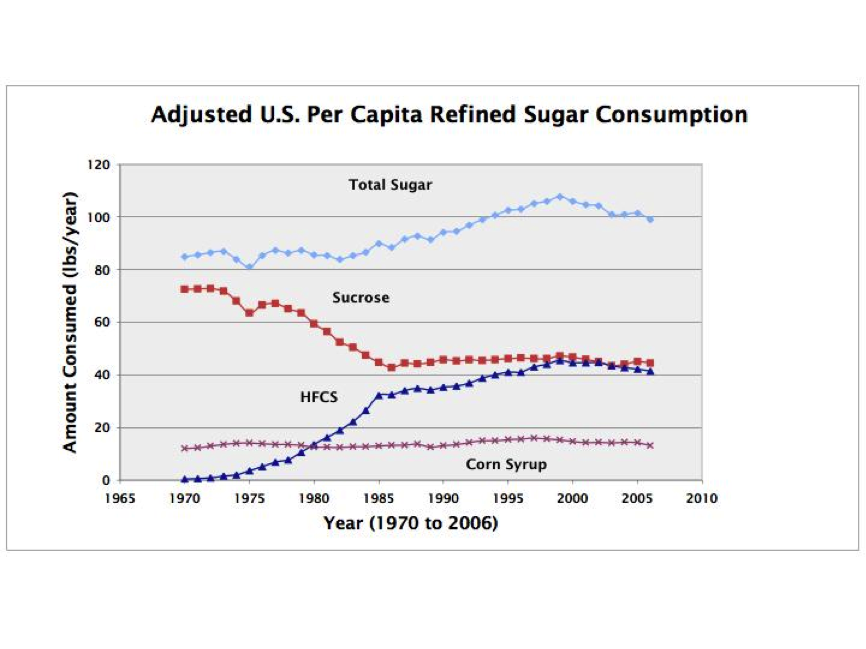
2. Sugar consumption takes off in the early 1980s.
Chart 2 shows that sugar consumption per person has increased from just over 80 pounds per year in 1980 to about 100 pounds per year or more over the last 20 years. Where we get this sugar from has changed too. Sucrose (table sugar) consumption has gone down and High Fructose Corn Sweetener (HFCS) has gone from essentially zero in 1970 to more than 40 pounds per year. This has led some people to label HFCS as the bogyman responsible for “all of this obesity”. A far bigger problem is probably just total sugar consumption.
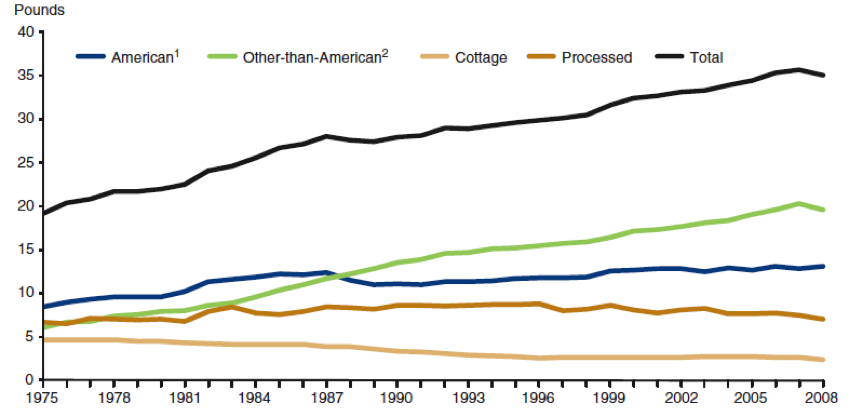
3. Cheese consumption has also skyrocketed.
Total cheese consumption as shown in chart 3 has also gone way up over the last 40 years. I am not sure what this means but just like sugar it is possible to construct a scenario where cheese is the culprit and “cause” of the obesity epidemic. A more plausible explanation is that the sugar and cheese consumption trends show what happens when agriculture policy is designed to generate a lot of tasty high calorie commodities that can then be turned into highly processed and convenient and low cost things to eat.
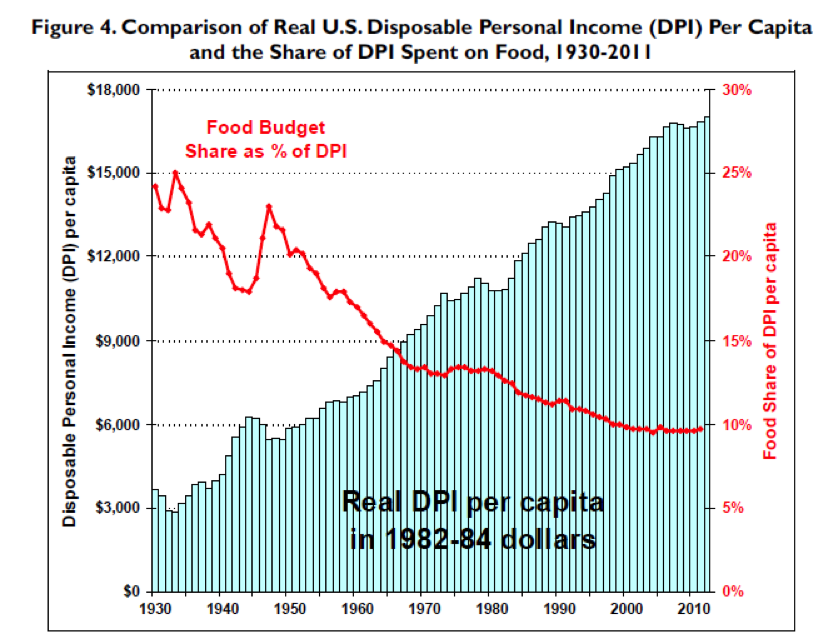
4. Cheap Food?
Chart 4 shows that the average person only spends about 10% of their disposable income on food. That is way down since 1930. The world does not get fat overnight or in just a year or two and the fact that spending on food went down so much in the 1950s and 60s might have set us up for the explosion of obesity that started in the late 70s. As I pointed out in the explanation of chart 3, this is another example of agriculture and food policy contributing to the problem.
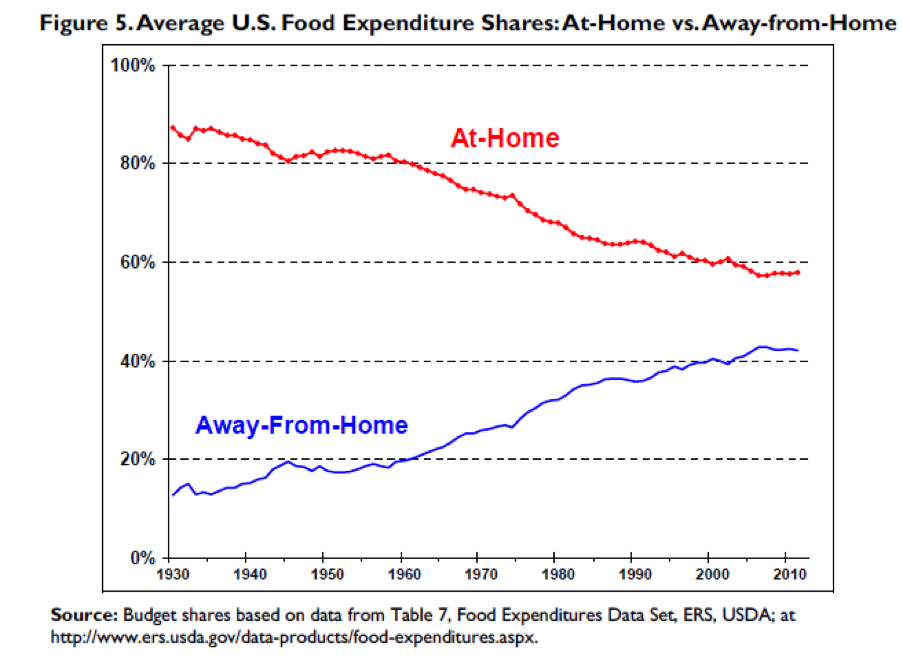
5. Eating Out?
Perhaps another result of “cheap food” ag policy and other changes in society like more mom’s working, people staying single longer, smaller families, and relentless marketing is that we eat far fewer meals at home than we used to as shown in chart 5. The people who sell us this food know how to pack the calories in and pack them in a way that keeps us coming back for more. The average person also typically underestimates the calorie content of the fast food they eat which amplifies the cheap food problem.
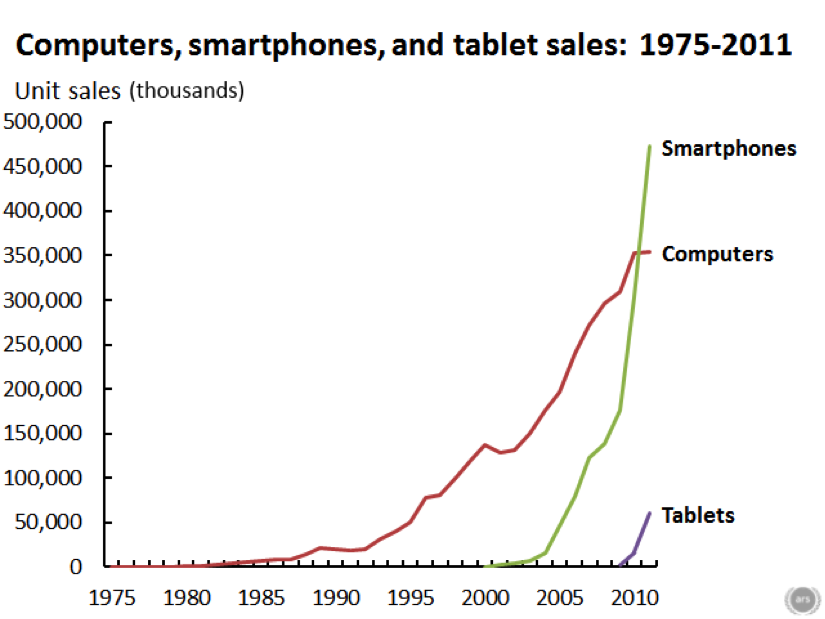
6. Screen time.
Chart 6 speaks for itself and is emblematic of the massive increase in screen time that we have all experienced since about 1980. Sitting in front of a screen can’t be good for your waistline.
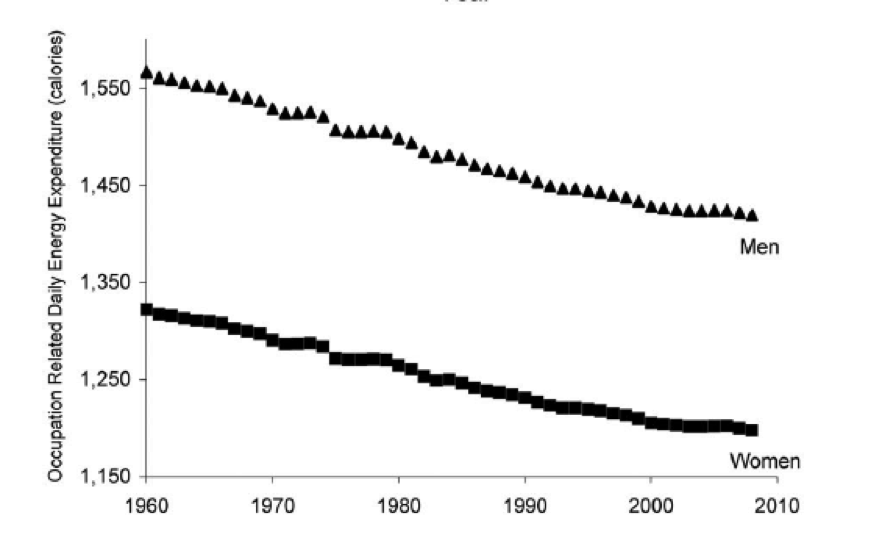
7. Occupational physical activity is way down.
Many people used to work at jobs that required either some or a lot of manual labor. Almost no one doses now, even the mailmen drive. Chart 7 shows that occupational physical activity is down by more than 100 calories per day for both men and women. This coupled with the fact that a lot of people get minimal or no recreational physical activity or exercise is another major problem. Some people have argued that the decline in occupational physical activity might explain most or the entire obesity epidemic.
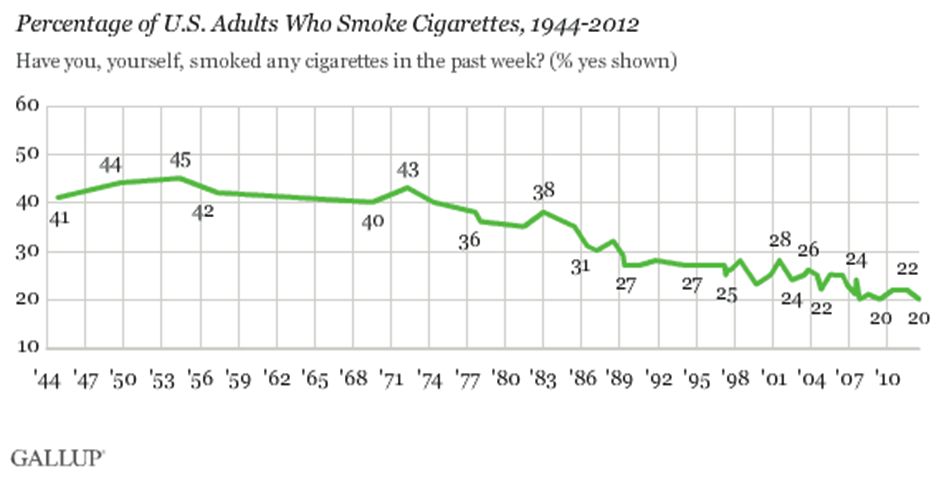
8. Smoking is down.
Smoking has also declined over the last 40 years and smokers tend to weigh less than non-smokers. So, one unintended consequence of the welcome reduction in smoking rates might be more obesity. This is a trade that most public health experts would gladly make except perhaps from people with extreme obesity. Just like sugar and/or cheese consumption, occupational physical activity, and screen time you can argue that less smoking “is responsible” for the obesity epidemic. But as I have tried to emphasize throughout this post, the cause is likely a combination of what we eat and less physical activity and not any “one thing”.
Closing Thoughts
The eight charts above are a sample of the many things that have likely contributed to the obesity epidemic. Thus, it is unlely there is any one explanation for the obesity epidemic and be suspicious of anyone who says there is. The charts also show that a multipronged approach will be required to turn the problem around. Changing food and agriculture policy and what we put in our collective mouths will be one part of any solution. Figuring out ways to get more of the population to build more physcial activity into their day will be the second part.

This entry was posted on Thursday, July 17th, 2014 at 5:41 am and is filed under Current Events, Research and Health. You can follow any responses to this entry through the RSS 2.0 feed. You can leave a response, or trackback from your own site.
2 Responses to “How the USA Got So Fat”
Leave a Reply
LIKE MIKE

SUBSCRIBE TO RSS

July 29th, 2014 at 1:54 pm
Do you suppose we’ll ever hit an obesity rate “ceiling”? Some percentage of the population, whether due to protective genetics, a highly active lifestyle, and/or smart eating habits, will likely never become obese. You and I fall into this group.
The overweight rate “ceiling” is probably another story, with a ceiling somewhere around 100%, since I suppose nearly everyone could in theory become at least a few pounds overweight.
Finally, your thoughts on how all this is measured? At 5’11”, 179 lbs, the CDC calls me normal. At 180 lbs, I’m overweight. And my equilibrium weight, where my body tends to gravitate toward, is around 183-185 lbs. Curiously, at all these weights, no objective observer would call me anything other than fit and lean. So, does the overweight data accurately reflect the situation on the ground?
July 30th, 2014 at 8:40 am
Matt, this is the problem with BMI for folks with a lot of muscle mass who are lean. BMI is great for the population as a whole, but there is a lot variability in terms of body fat. There are also so-called skinny fat people with low BMIs but plenty of fat and they have poor health outcomes.
About the upper limit of obesity. Too soon to tell, things might be leveling off, and it really can’t get much higher.
Mike