
Archive for October, 2014

The NCAA vs. Reality
The most recent piece of bad news on the academic and financial integrity front for big time college sports in the United States is the news of a zombie major and related courses at the University of North Carolina. These courses were used to buff up the grades of “student-athletes” and make it easier for them to remain academically eligible. The news is especially troubling because the University of North Carolina (UNC) is an elite academic institution and a member of the Association of American Universities. This is a group of the 62 leading research institutions in the United States that includes the Ivy League, Stanford, and many major public universities.
Since the story broke I have had a number of e-mail exchanges with friends over the last week about this topic and the thing I find puzzling is why UNC had to go this far (or turn a blind eye) to keep marginal students eligible for big time and big money college sports. Some approaches used at the big schools to keep athletes eligible are legitimate and are known as “academic support services”. However, there are several approaches that can be used that are more or less “within” the rules but make it essentially possible to cheat and avoid a lot of scrutiny and thus get by. Here are some:
1. Create an Easy Major
A number of schools have created “safe harbor” majors that generally lack rigor and can make it relatively easy for less able or less interested students to get the grades needed to be academically eligible to compete in sports. These schemes are well known and if UNC did not have such a major, my bet is they will develop one. If UNC had one, then the scandal makes them look even more incompetent than they are.
2. Gaming Transfer Credits
It is possible for student athletes to take courses at junior colleges or via distance learning and use passing grades in such courses to remain eligible. If this is done discretely it can work well. However, usually the word gets out and things ultimately implode. My favorite story is one from the 1990s that focused on a small Christian Bible School that offered correspondence courses for ministers. When interest in some of their offerings skyrocketed, the folks running the school felt their prayers had been answered and were gratified to know that college athletes were interested in biblical history. What really happened is that some assistant coaches had figured the school and its courses to be an easy mark to keep people eligible by systematically cheating on the tests and getting the needed grades. If this had stayed small time, it might still be going on.
3. Johnny Football and On-Line Courses
The next big thing in the keep them eligible world is going to be on-line courses. Johnny Manziel used this approach while at Texas A&M. My guess is that the next major academic scandal in college sports will have an on-line element.
Summary
There are all sorts of other strategies that have been used over the years and some great anecdotes about them. They include things like ghost written term papers and bogus class attendance. A less known problem is the academically qualified athlete who is discouraged from doing something rigorous because it might interfere with practice time or their commitment to the “the program”. This summer I talked with a mid-major basketball player who wanted to be a dentist but was shunted away from pre-dentistry into another major on the advice of his coach. Did the coach have the player’s best interest at heart, or was he trying to ensure he developed a top mid-major program and then got a multi-million dollar offer from a bigger school? Most universities try to manage conflict of interest by their faculty who consult, start companies, or develop intellectual property. Maybe they should try it for their coaches and athletic departments. Maybe the NCAA should acknowledge the reality of what is going on and mandate it.

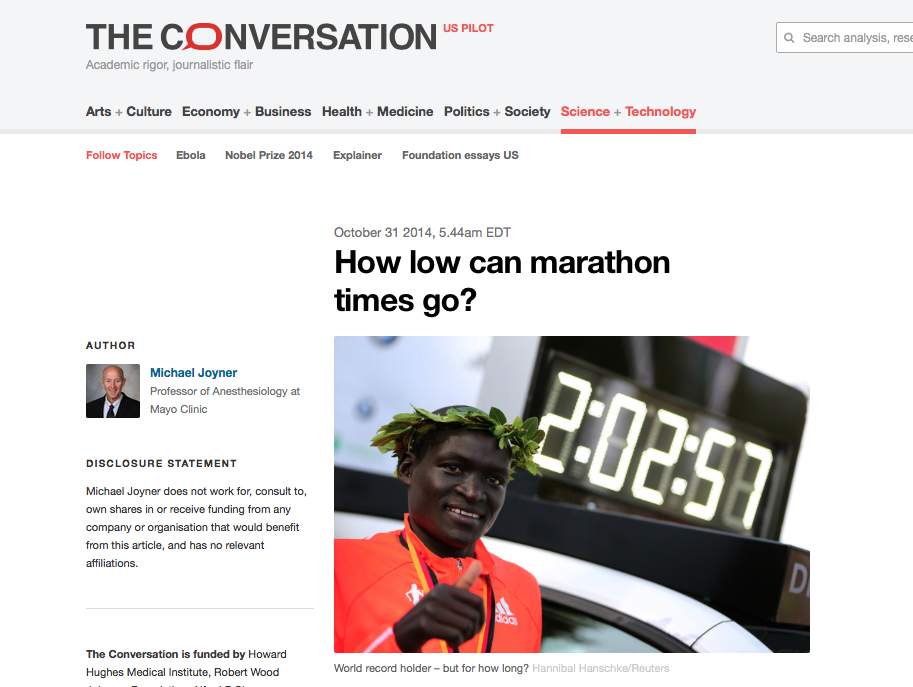
Everything You Need to Know About Endurance Training in One Race!
Last Saturday was the 50th anniversary of Bob Schul’s victory in the 5,000 meter race at the Tokyo Olympics. Schul, who was from the United States ran 13:48.8 and beat Harald Norpoth of Germany and Bill Dellinger also from the U.S. The great Kip Keino of Kenya was 5th anticipating his Olympic success in 1968 and 72, and also anticipating the rise of the Kenyan runners. It was a close race run on a slow and muddy dirt track. The last few laps of the race were very fast in spite of the conditions.
Training Methods 101
The race also serves as a short primer on training methods:
- Schul was interval trained and literally did intervals twice a day almost every day. I looked up some of his old workouts in the classic book “How They Train” by Fred Wilt. He might do a brief warmup and then 30-40 times 100 meters in the morning. The afternoon would include a brief warm up and then many longer intervals between 150-400 meters. My guess is that this sometimes added up to about 70-80 miles per week.
- Norpoth was a disciple of Ernst Van Aaken the originator of so-called long slow distance (LSD) training that included very high mileage. He did long slow runs up to 30 miles or more and also restricted his diet to get as skinny as possible. Mileage well in excess of 100 miles per week was done and perhaps only about 5% of the total was anything near race pace.
- Dellinger, who was later the track coach at Oregon, was coached by the legendary innovator Bill Bowerman and did the sort of mixed training popular today which would include longer runs, intervals, hills, and sprints. This program also featured the classic hard-easy pattern advocated by Bowerman.
- Also in the race was Ron Clarke, who ultimately set 19 distance running world records. Clarke did a lot of long fast continuous runs with surges and raced often and fast. He did what we might call threshold training. Clarke also frequently ran more than 100 miles per week in training. What he did in the 1960s also seems similar to what anecdotal reports indicate the East Africans are doing today.
Take Home Messages
The narrative above makes me an unbeliever in the idea that there is a “best way” to train or that much has really changed in the last 50 years. You can also find similar stories and varied approaches in other endurance sports with examples of success stemming from all sorts of programs.
However, all of the training programs outlined above were marked by several hours a day of training at least a couple of days a week or more. They would all also evoke essentially maximal physiological adaptations in most people. All of the programs also included at least some fast running. In talking with LSD trainers who were successful in the 1960s and early 70s, many have told me that in addition to their training they also ran a whole lot of races including “doubling” at track meets by running multiple events. This clearly supplemented the limited formal speed work they did in their regular training.
Another take home message is that depending on where you live and what resources are available one program might more sense than another. For example if you live in an urban area where finding the right course for a long run can be challenging, maybe an interval focused program on a track or in a park makes the most sense. If you live in a place full of trails, hills and mountains perhaps one of the less interval focused programs would make more sense.
Whatever the program there is no substitute for consistency and at least some fast running. Consistency also means staying injury free, so at least some easy days every week make sense as well. Also, don’t forget to ask yourself “what is the purpose of this workout?” and perhaps “what is the ultimate goal of this training program?” If you can’t answer those questions maybe you should rethink things.
What Happens if Life Expectancy Keeps Rising?
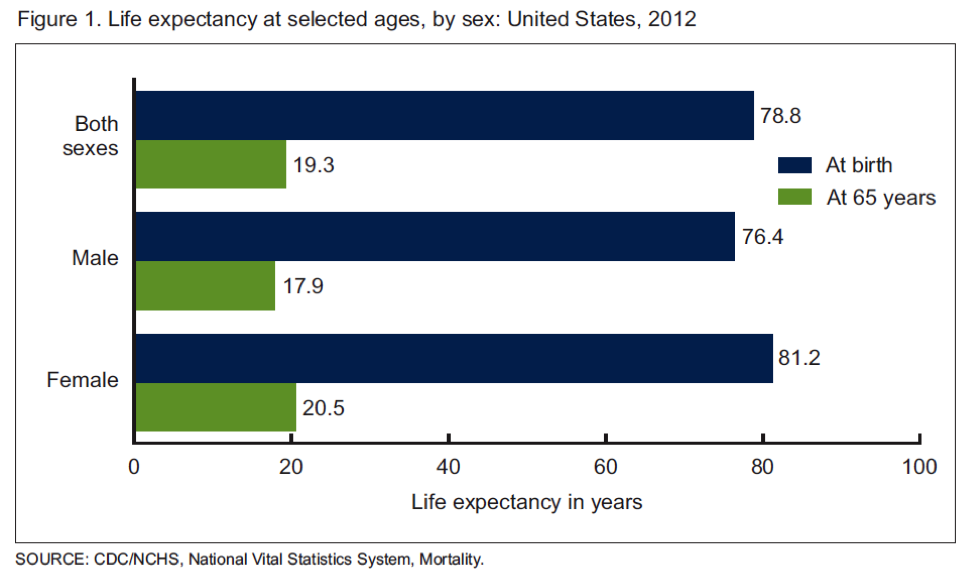
The US Centers for Disease Control (CDC) recently released its annual report on life expectancy. The data covers 2012 and show life expectancy continuing to rise in the US. The chart below is the current data and the overall average is a little over a month higher than the estimate for 2011. Additionally, there were gains in most ethnic subgroups. The green bars in the chart also show that the average person who makes it to 65 will likely live another 19 plus years. That number is also trending upwards.
US Life Expectancy Still “Low”
Life expectancy is still relatively low in the US compared to other rich countries with numbers in the low 80s. The reasons for this are complex and center on issues primarily related to economics, behavior, and to a lesser extent access to medical care. The chart below is from an excellent 2007 report from the Social Security Administration, it shows that for men life expectancy at age 65 is going up faster for those in the top half of income compared to the bottom.
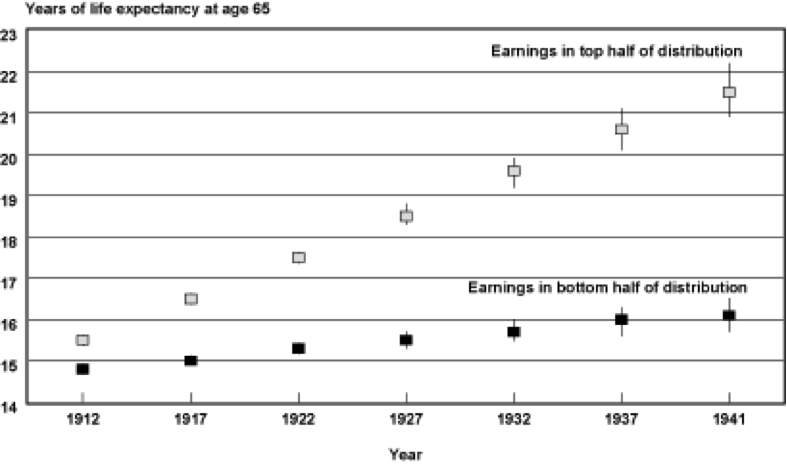
For example for men born in 1912 both groups could expect to live about 15 more years. For those born in 1941 those in the lower half could only expect 16 years of additional life compared to their better off counterparts could expect about 21 years of additional life.
How High Can Life Expectancy Go?
In previous posts I have tried to dissect out how much of some of these life expectancy gaps are due to things like differences in health behaviors and or economics. If life expectancy for people who are less well off “catches up” with the numbers for the better off it could have major implications for the overall number. There was also a great longer article in the Atlantic about the implications of a population wide life expectancy of 100. The article also highlighted a debate in the epidemiology community. Some people see life expectancy continuing to rise while others see it flattening out somewhere in the 80s. There is also some speculation that it might decline due to the obesity epidemic and a rise in diseases like diabetes. The next chart is from a classic 1990 paper and shows what happens to life expectancy at age 50 for both men and women if cancer, cardiovascular disease and diabetes are eliminated. Life expectancy rises but tops out at 90 for men and 96 for women.
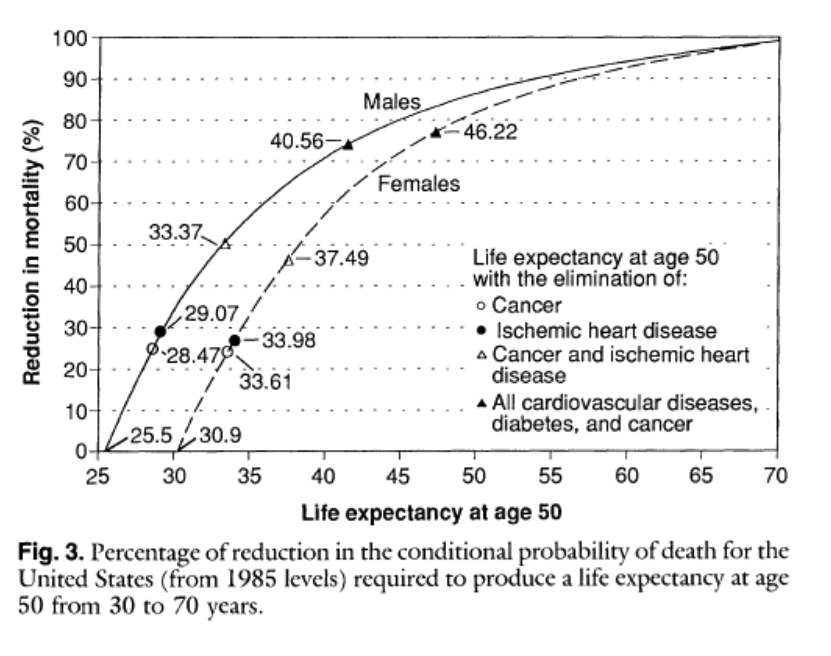
This type of analysis argues that while life expectancy might continue to rise, it is not going to get 100 anytime soon without the development of some sort of magic bullet anti-aging therapy. It is also interesting to note that populations of “guideline followers” who don’t smoke, exercise, don’t get fat etc. frequently live to about 90.
Structure of Society
The next two charts are “population pyramids” for the US. The first is for 2000 and the second is an estimate for 2050. As life expectancy increases and the average woman has fewer children the population will age.
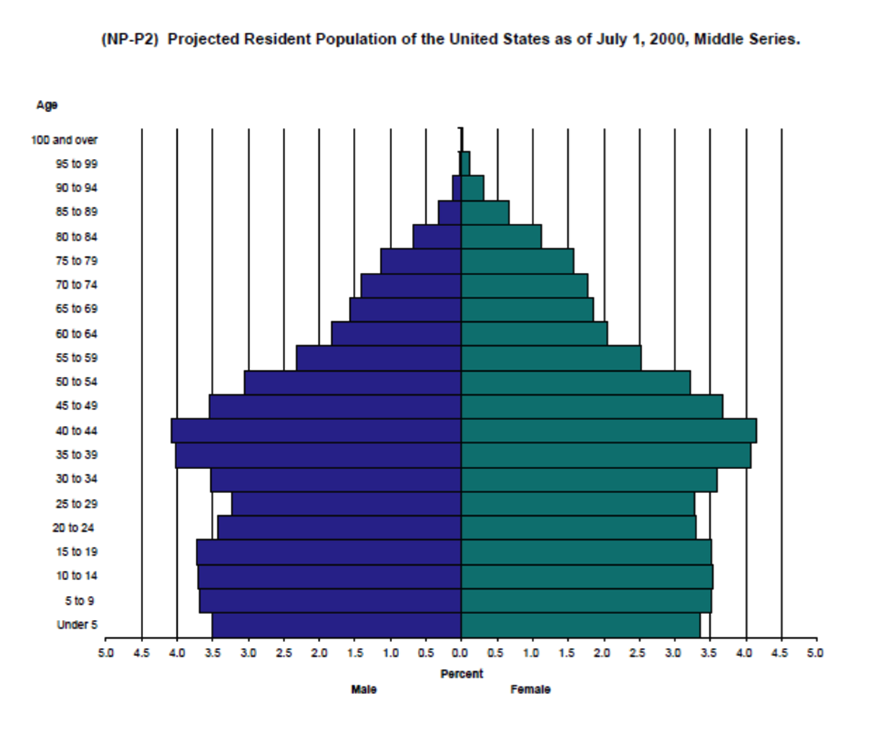
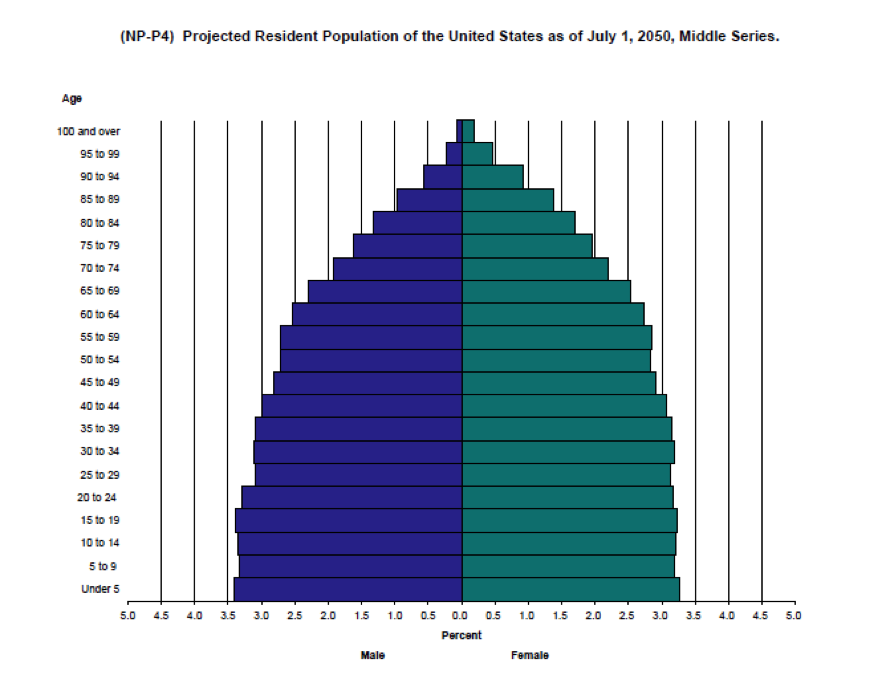
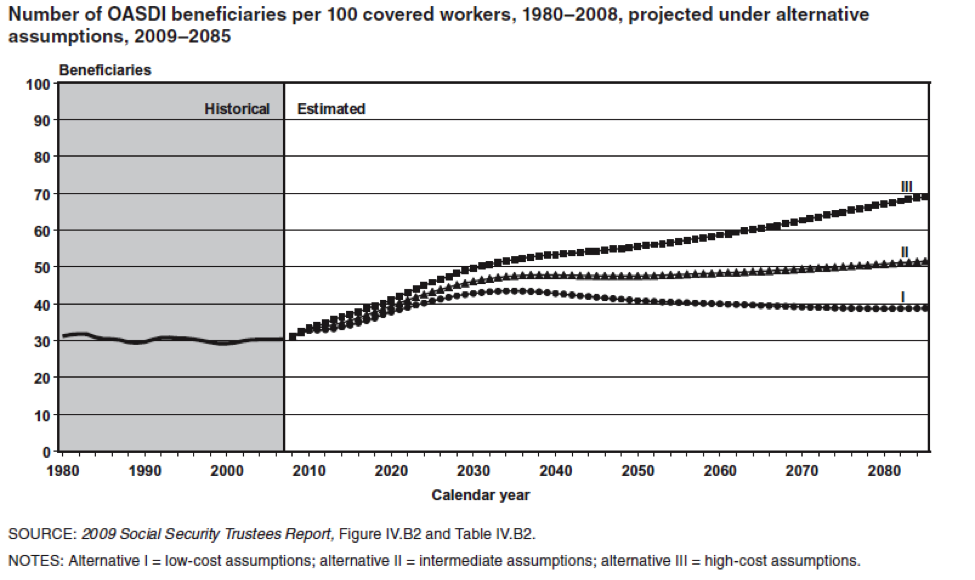
The key point is that there are going to be a whole lot more old people that there used to be and the next chart shows the implications for this in terms of the number of workers to retirees. Today there are about 35 people receiving Social Security benefits for every 100 workers. In 2050 that number will be about 50 per 100 or perhaps as high as about 55 per hundred. Some version of these ratios will ultimately affect all programs directed at our aging population.
Something Has Got To Give
As a result of the aging population, the long term implications of programs like Social Security and Medicare on the US Federal Budget have been well known for many years. There has been some recent good news on the economic front in terms of the relative robustness of the US economic recovery compared to historical trends for recoveries after financial meltdowns. Additionally, health care spending has moderated and there is some positive news on the federal debt. All of this has provided the President and Congress with a window of opportunity to address some of the fundamental issues associated with an aging population. However, for Social Security and Medicare none of the choices will be “fun” for political decision makers because solutions include things like:
- Raising the retirement age
- Cutting or restructuring benefits
- Raising taxes
Given the gridlock in Washington, my personal bet is that nothing will happen until the later 2020s when the problem of how to finance social programs for an aging population becomes more acute as a result of increasing Federal debt and concerns about the solvency of the trust funds linked to the programs. Coming up with long terms solutions sooner rather than later would surely be less painful in the long run. However, I don’t expect any sudden outbreaks of either the political courage or the negotiating skills needed to address the fiscal challenges of an aging population until there is a crisis.
The Obesity Tax vs. Sin Taxes & Big Soda
There is lots of interesting news on the obesity front and I thought it might be fun to highlight a couple issues and raise a few questions.
How Fat Are We?
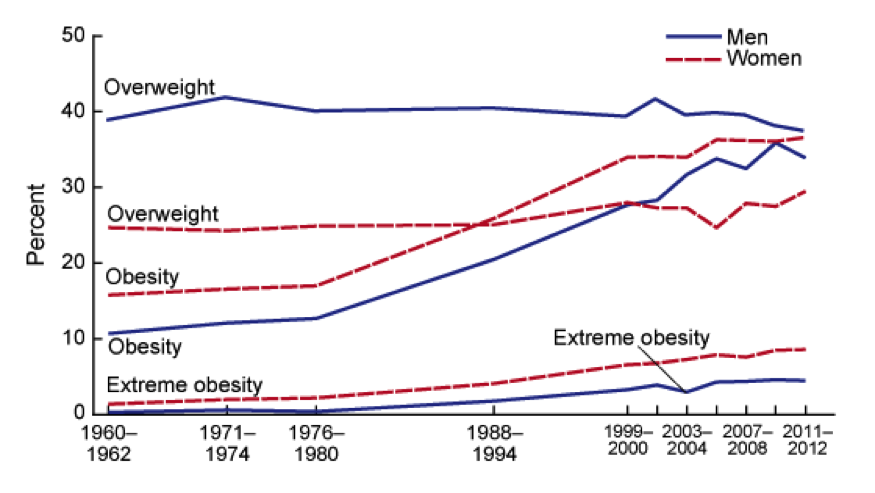
The chart below shows the trends in obesity or overweight in the US over the last 50 years. Things might be leveling off a bit, but the question really is how much worse can it get. In fact some epidemiologists are asking if eventually all Americans will be obese or overweight. For those of you not familiar with the definitions of obesity and overweight you can find them here.
How Much Does Obesity Cost?
The estimates are all over the place, but according to Forbes it is on the order of 450 billion per year or a little less than 3% of GDP (16.8 Trillion) or about 70% of what we spend on national defense. Some of this is medical costs, but some of it is productivity, fuel costs, food costs, you name it. It is also a lot of money any way you look at it and I believe that the $450 billion estimate is only for obesity and not for overweight. Of course things scale as both individuals and society as a whole moves up the scale, so the combined costs of overweight and obesity are likely significantly higher than those for obesity alone.
What About Big Soda?
The other related news is that there are soda tax questions on the ballot this fall in San Francisco and Oakland, and given the 0 for 30 plus track record of similar ballot questions, some are calling this the “last stand” for soda taxes. As you might imagine this initiative is facing major opposition from so-called big soda, a phrase used by activists to conjure up images of big tobacco and big oil. At the same time “big soda” is promising to voluntarily reduce calorie consumption from their products by 20% by the year 2025. Skeptics have called this a move to avoid or delay regulation right out of the safer cigarette playbook.
Who Pays?
While there is way more to obesity that sugar and sugary drinks, it seems to me that all of us are paying essentially a hidden obesity/overweight “tax”. Thus it might make more sense for those who use products linked to obesity to actually pay a real tax for their behavior. This could raise revenue to cover some of the costs of the problem and might also lead to behavior changes to reduce the magnitude of the problem. Comprehensive tobacco control took decades to happen. Given the costs and health consequences of obesity, how long will a comprehensive program for calorie control take to emerge? It is almost certainly coming one way or the other.
You are currently browsing the Human Limits blog archives for October, 2014.
LIKE MIKE

SUBSCRIBE TO RSS
