
Archive for January, 2013
Rochester Free Phys Ed
In a post last September colleagues from the University of Kansas highlighted a free exercise program in Lawrence, Kansas known as “Red Dog’s Dog Days”. I have been studying exercise in the lab since I was 19 years old, and that got me thinking that it was time to get out of the Ivory Tower and try something similar in Rochester, Minnesota during 2013. My wife Teri was enthusiastic and so was Wes Emmert, an experienced strength and conditioning expert. Wes has forgotten more types of calisthenics, body weight strength exercises, and agility drills than most of us have ever heard of. He also knows how to stop people mid position during push-ups for a 5 second hold to make things more “enjoyable”!
The initial plan was to pilot the program on Saturday mornings with friends this winter and then open things up to the community in April. However, the local paper reported on one of our earliest sessions and things have accelerated from there. We now have a Facebook page and during the first month more than 50 different people have participated in our Saturday morning workout –10:30 at Soldiers Field track, EVERYONE IS WELCOME! The youngest participant has been less than 10 and the oldest around 70. Most people seem pretty fit to start with but it is also clear we have some beginners and folks perhaps looking to lose a little weight or get back in shape. The goal is to make the program welcoming to people of all ages and fitness levels and provide everyone a workout they can calibrate to meet their own goals.
All of this has happened outdoors which makes it even more impressive considering how cold and windy it is in January in Minnesota. Here is a sample of what we did a couple of weeks ago:
- Stationary Warm-up (neck circles, jumping jacks, etc)
- Moving Warm-up (over/under hurdles, knee to chest walk)
- Push ups for 60 seconds – lunge to first pole and jog back
- Mountain climbers for 60 seconds – high knees to second pole and walk back
- Squats for 60 seconds – butt kicks to third pole and walk back
- Planks for 60 seconds – skip to fourth pole and walk back
- Sit ups for 60 seconds – run to fifth pole and walk back
- Split squats for 60 seconds – jog to fourth and walk back
- Abs of choice for 60 seconds – side shuffle to third pole and walk back
- Back extensions for 60 seconds – grapevine to second pole and walk back
- Burpees for 60 seconds – walk to first pole and back
- Cool down – (yoga)
- Optional 2 mile run
So, what have I learned so far? I have learned that burpees (squat thrusts), planks, lunges, and mountain climbers are much harder than I remember them being in about 1975. I have been sore for a couple of days after doing them on Saturdays and am now incorporating these movements into my training during the week. I have also learned that it is pretty easy to stick with what you know and what you are good at. Endurance sports have always come easy to me and my approach has typically been when in doubt go for a run, get on the bike or hit the pool. The data shows that as we get older staying strong is really important and my struggles with these simple body weight maneuvers has been an eye opener. Our ability to literally get up off the floor as we age is a pretty good predictor of healthy aging and even longevity. Doing challenging old-school calisthenics would seem like an easy way to address this issue. I am also thinking about starting to jump rope again (remember high school basketball practice?) to improve my footwork and general coordination.
The other thing I have re-learned is that working out with a group is fun and so is using a bull horn and a coach’s whistle. If the program grows, we may have to invest in an air horn!

Recovery & Active Rest
I got an e-mail a couple of weeks ago from a reader about when to start training again after a marathon. That is a pretty broad based question and the answer depends on all sorts of things including the training background and goals of the athlete, the course he or she just ran, and just how sore and tired the runner was after the race. Here are a few things to think about.
Delayed Muscle Soreness
After a period of exercise, especially trying something new, people frequently experience so-called delayed muscle soreness that usually peaks about 48-72 hours after the bout of exercise. This can also happen after something like a marathon and downhill running is a notorious way to generate delayed muscle soreness. The idea is that microdamage to muscle and inflammation lead to the soreness and pain. Going down stairs is particularly uncomfortable but going downstairs backwards typically is much easier. What is interesting is that things like stretching and cold water immersion post-exercise don’t seem to help that much. Drugs like ibuprofen can help with the soreness but may not improve muscle function either. The best way to avoid delayed muscle soreness is to start a new program slowly. One key for running races with a lot of downhill is to actually do some training going downhill.
Training After a Marathon
The rule of thumb is that it takes about 1 day per mile to recover from a race. So 6 days for a 10k and 20 plus days for a marathon. I am not sure where these rules of thumb came from and again they would depend on how trained the runner is and a lot of the individual factors mentioned at the start of this post. However, there is some research on what happens when people do run in the days right after a marathon and whether it speeds recovery. In a classic study from the 1980s, scientists at Ball State University studied 10 young male runners who ran a marathon on average in less than 3 hours. Half of the runners ran for 30-45 minutes per day the next week, and half rested. The authors concluded that:
“Seven days rest postmarathon did not allow complete recovery of maximum peak torque (MPT) nor did exercise facilitate recovery of work capacity. To prevent impairment of the normal course of recovery postmarathon, exercise intensity and duration must be judiciously selected.”
Active Rest
So what to do? After something like a marathon give yourself at least a week or two to recover. One idea is to use something called active rest. This might include things like cycling, swimming, or deep water running for a few days at 50% effort for about 30 minutes until the delayed muscle soreness has passed. Then slowly add a bit of running. Daily training is a part of the routine for most people who do marathons so there is no need to get out of your routine. However, there is nothing magical about “running the next day”, so give it some time and substitute other activities. One of the nice things about both biking and swimming is that they seem to generate much less of the soreness associated with running.
The Post Lance Future of Doping
I have gotten a lot of e-mails and chatted with a number of friends about the future of sports doping post Lance and Oprah. Here is a sample of what has come up.
The Future of Doping? A couple of people sent me a link to a New York Times piece on doping in the 21st century. Among other things this piece talks about so-called gene doping and other high tech approaches to doping. I am a bit skeptical in the short run because literally billions of dollars have been spent on gene therapy for medical conditions like cystic fibrosis with limited success. So when gene therapy becomes a reality in clinical medicine we can maybe revisit the possibility of gene-doping in sports.
The 1% Solution? Most people, including journalists, fail to understand that a 1% edge in something like a 10,000m running race means the doper wins by 100m, a huge margin. This also means that there is no need to use industrial strength doping. Thus doses of things like EPO and steroids can be given at levels beneath the threshold of detection with any imaginable drug testing technology. A number of people, and I am one of them, are shocked that anyone fails a drug test given how beatable they are. The low rates of positive tests at things like the Olympics can be seen as proof that testing is working or proof that testing is beatable. Perhaps it is some of both.
Brand Protection vs. Drug Testing? Some argue that all the sports federations, leagues, sponsors and TV networks want is the appearance of clean play and that depending on the situation they intentionally or unintentionally turn a blind eye toward doping. The idea is that if they really cracked down, all sorts of people would have to be suspended, and the “product” would be second rate. The best example used to support this reasoning is the widespread suspicion that management tolerated or even tacitly encouraged steroid use in Major League Baseball in the late 1990s after the 1994-95 baseball strike. Was doping part of a pact of ignorance designed to generate home run records and get fans back in the stands?
How Many Tours Would Lance Have Won Without Doping? The short answer is who knows. The Tour de France is a long and brutal three week race that lasts about 90 hours with margins of victory of only a few minutes. Additionally, perhaps only 5 to 10 of these hours are typically decisive. So to win, the champion must be lucky and not crash, have a team to protect him on the long boring stages, and then do well in the time trials and on a limited number of the steepest climbs. Time trialing and steep climbing are especially sensitive to something called VO2 max and this is where EPO use or blood doping would make the biggest physiological difference. So Lance appears to have had the best doped team, best able to protect him and his doping strategy was optimized for the critical stages. However, based on what others have said he also trained like a maniac and left nothing to chance. So again, who knows……. he might have won several but I doubt seven in a row.
The Level Playing Field? Everyone was doping therefore it is “dope or be marginalized”, that is more or less one of the arguments Lance made to Oprah. Just like the average person and journalist do not understand what 1% is worth, most don’t understand what it is to be immersed in a micro-culture where the only things that matter are the last race or workout or the next race or workout. So the temptation to dope is immense. The 1968 Boston Marathon champ Amby Burfoot has recently commented on this and wondered whether he would have doped back in the day. I applaud Amby for being so honest.
What Next For Lance? I see three paths:
- He gets caught in a downward spiral of lawsuits and legal proceedings over the next few years and his downfall is complete and might include prison time.
- He drifts into irrelevancy and perhaps ends up on a reality TV show for faded celebrities down the road.
- He names his enablers, has a protracted apology tour, settles the lawsuits and is back in business one way or another.
If I were betting, I would bet on number three. Never underestimate someone as driven as Lance Armstrong.
The Future of Longevity
In several recent posts I have tried to provide some information about life expectancy and measures of public health that might inform the current debate on raising the eligibility age for Medicare and perhaps Social Security. These posts focused on some basic facts about longevity trends over the last 50 plus years. I also highlighted differences in life expectancy for men and women and also the influence of race and socioeconomic on life expectancy. Finally, I made the point that behavioral and other risk factors that operate throughout life need to be addressed if we want to narrow the effects of sex, race, and money on life expectancy. In this data heavy post I want to focus on the future of longevity and ask what this might look like going forward. One idea is that life expectancy is going to continue to rise, and the other idea is that as a result of the obesity epidemic and other factors it is going to flatten out.
What the US Social Security Administration says
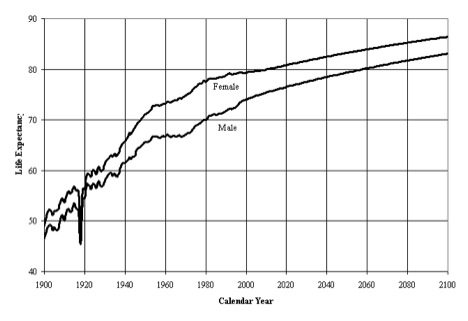
The next four figures are from the U.S. Social Security Administration (SSA) and might be described as the “official” estimates from 2005 for what might happen to life expectancy in the future. Here is a description of the first figure from the SSA report.
“The figure shows life expectancy at age 0, by sex and calendar year, based on period life tables. Rapid gains in life expectancy at age 0 occurred from 1900 through the mid 1950’s for both males and females. From the mid 1950’s through the early 1970’s, male life expectancy at age 0 remained level, while female life expectancy at age 0 increased moderately. During the 1970’s faster improvement resumed for both males and females. Life expectancy for males and females in the 1980’s improved only slightly with males improving more than females. In the 1990’s, life expectancy has remained fairly constant for females, increasing only slightly for males.”
The second figure is also from the same SSA report and shows trends and projections in life expectancy at age 65.

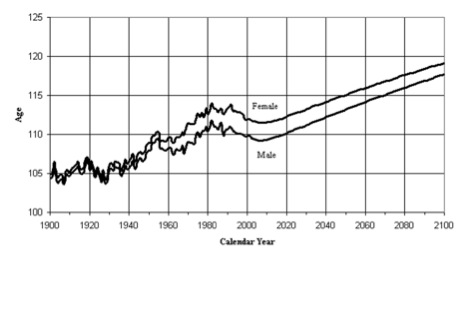
The third figure from the SSA report I want to show is about the age of the oldest of the old…….people who truly are one out of 100,000. For those interested in the topic of extreme aging here is a link to a list of the oldest lived people in history.
The final figure is comparative survival curves from 1900 to 2100. Here is a description of this figure from the SSA report.
“This figure presents the population survival curves based on period life tables for selected calendar years. Great strides were made in the twentieth century toward eliminating the hazards to survival which existed at the young ages in the early 1900’s. Very little additional improvement to survival rates is possible at these young ages. Survival rates at the older ages are projected to continue to improve steadily. Projected gains in the probability of surviving to age 90 during the next 50 years are about the same as experienced during the past 50 years. For age 100, projected gains are much greater than for the past. Figure 5 shows population survival curves based on period life tables for, from left to right, 1900, 1950, 2000 and projected years 2050 and 2100.
Although the shape of the survivorship curve has become somewhat more rectangular (less diagonal) through time, it appears that very little additional rectangularization will occur because survival rates are already so high at the young ages and are expected to continue increasing at older ages. The so-called “curve squaring” concept, though appealing to many, simply cannot be supported by the mathematics of mortality. The age at which the survivorship curve comes close to zero, through the compounding of single-year probabilities of survival, has increased greatly during the twentieth century and will continue to increase, as further strides are made against degenerative diseases. That mortality rates are found to continue to decline, at every age for which adequate data are available, demonstrates that no absolute limit to the biological life span for humans has yet been reached, and that such a limit is unlikely to exist.”

Looking past the Social Security data
As I noted in my introductory comments, there are two basic ideas about the future of longevity. The first idea is that life expectancy is going to continue to rise and that the curves above might be underestimating life expectancy in general and the fraction of people who make it to 100 or older in specific. If this occurs the public policy implications for the funding of and eligibility for Social Security and Medicare are problematic at best and a demographic time bomb at worst. Here is a quote from the article by Olshansky and colleagues:
“The cumulative outlays for Medicare and Social Security could be higher by $3.2 to $8.3 trillion relative to current government forecasts……….”
There are also concerns about the techniques used to make life expectancy forecasts for the Federal Government that might lead to underestimates over time. The second idea is that life expectancy is going to decline due to obesity and other factors. The people who take the position that life expectancy might fall are also concerned about the techniques used to make these forecasts and that they might lead to overestimates of projected changes in life expectancy.
Caveats & Conclusions about the future life expectancy and where this will lead
- Any changes in life expectancy are likely to be unequally distributed in the population at large. They are more likely to be seen in educated, well-connected better off people. Even in a country like Sweden where heroic steps have been taken to reduce health care disparities and inequalities, there are still health disparities and inequalities in life expectancy.
- The genetics of who makes it to 90 or 100 are not well understood and no obvious genetic markers that predict extreme old age have been identified. There is also some evidence that none will emerge with further research.
- My personal opinion is that trends in life expectancy will be divergent with some people trapped in a cycle of lifestyle related diseases and low social autonomy. There will be another group of long lived super guideline followers who will be generally well-educated and better off. These people will also be physically active, non-smokes, relatively normal weight, moderate drinkers, and engaged in life.
Lance Armstrong vs Richard Nixon
News reports indicate that Lance Armstrong will admit to doping when he is interviewed this week by the media impresario and TV personality Oprah Winfrey. In a number of earlier posts I have laid out the pros and cons of the Lance doping case, his motivation to dope, stonewall and then stop contesting doping allegations, and the idea he might be seeking a “second act. In addition to looking for some sort of return to the limelight there is at least some speculation that Lance is worried about criminal charges if he admits to too much.
All of this makes me think about Richard Nixon, who resigned the Presidency in the wake of the Watergate scandal, and a series of interviews he did with David Frost a few years after he resigned. Nixon and Armstrong both grew up under tough circumstances. They were both self-made, tenacious, incredibly resilient, and devoted practitioners of hard-ball tactics. Lance “won” the Tour de France 7 times; Nixon is the only man to be on the National ticket of a major political party and run for President or Vice President five times. Frost was an all-around media operator and society high flyer before Oprah took these labels to a new level.
That having been said, Nixon fundamentally never saw Watergate as more than a political problem vs. a series of criminal acts. The clip below shows this pretty clearly. Will Oprah be able to get a similar admission out of Lance? Nixon saw Watergate as political gamesmanship that needed to be contained. Will Lance tell Oprah that he saw allegations and denials concerning his well-organized doping program as athletic gamesmanship that needed to be contained vs. a vast and corrupt criminal conspiracy that did all sorts of damage to all sorts of people?

click here for video
In the next clip Nixon says:
“I don’t go with the idea that there … that what brought me down was a coup, a conspiracy etc. I brought myself down. I gave them a sword, and they stuck it in and they twisted it with relish. And I guess if I had been in their position, I’d have done the same thing.”
click here for video
Nixon, for all his faults, understood that in the end he was a victim of his relentless and even obsessive use of hard ball tactics. Will Lance ever understand this? Additionally, at least until now, Lance clearly has not grasped the central lesson of Richard Nixon’s life……..that a cover up is always worse than whatever led to it.
Richard Nixon can be seen as tragic giant. If Lance is lucky he will avoid prison, retain some of his fortune, and re-emerge as a less than first rate celebrity.
Indoor Training Questions
Today I want to focus on two practical questions from readers. The first question comes from Bob Fix who is a late 30 something IT person in the Twin Cities.
My question is for those (like me) who want to achieve a higher level of training in the coming year, but are conscious of calories and want to lose more weight: What is the physiological response to “under” nutrition (not enough calories) and more intensive training?
A bit more information, Bob is an avid cyclist and last summer he rode almost 4,000 miles and lost about 20 pounds doing a lot of group rides. He is currently doing about 3-4 indoor aerobic workouts of around an hour per week and strength training 1-2 times per week. The aerobic workouts include some higher intensity efforts. Bob also wants to avoid gaining weight this winter so he is ready to go when it warms up. He is currently counting calories and really watching what he eats and shooting for about 1900 calories per day. Here is a summary of some ideas I shared with Bob:
- For bang for the buck indoor training I prefer the type of interval workouts I have outlined in the blog. This approach keeps you cardiovascular fitness high and then when Spring/Summer rolls around you are good to go. It looks like the workouts you sent have some of these elements so if they are working, keep doing them. Weights a couple of times per week are also a good idea as will be discussed in a bit more detail in response to question #2 below. So, I think you have the bases covered in terms of winter working out.
- Biking on the road is always essentially interval or fartlek training due to hills, drafting, the wind etc. So this is another reason to do some higher intensity exercise during your indoor sessions this winter.
- About counting calories, see what the 1900 cals/day does to your working out. If you feel overly “wasted” and are not recovering then up the calories a bit. The other issue in the winter is the temptation to drink a bunch of beers and eat a plate of wings or something while watching a football game. To avoid situations like this, people who are successful at keeping weight off typically have plenty of carrots and low calorie snacks around to munch on. There is also at least some evidence that people who work out for longer overestimate the calories they are burning, or that more prolonged exercise stimulates their appetite and can make it harder to keep weight off. When you are doing multiple hours of riding per day in the summer this is likely less of an issue, so calorie counting can be important for people when they are doing the types of workouts you describe.
Summary, see how the diet goes and make minor adjustments so that your training does not suffer. More weight will come off when you get outside and the duration of your weekly training picks up. The key is to not lose what you gained in terms of fitness and to gain what you lost in terms of weight over the winter.
The second question comes from Dr. John Schmidt a colleague who is a research and clinical psychologist at the U of Pittsburgh.
I would be very interested in your thoughts on weight training worked into a typical fitness routine. I recall much controversy regarding the use of weights and the potential for detrimental vascular effects.
Here are a few thoughts on this topic:
- Current guidelines now emphasize the need for strength training for middle aged and older adults. The concerns you mention have not panned out and a bigger problem is that many middle aged and older people lack the strength to do their activities of daily living. Grip strength is also a powerful predictor of health as we get older, and it is even predictive in younger people.
- There is some controversy for more competitive people about whether cyclists or runner for example should do weight training with their legs. For cycling some studies are positive and others are negative so there is not clear answer and there is also no clear answer for running. However, there are some positive indicators in more elite runners. For both cycling and running it is probably a matter of whether the fatigue associated with the strength training interferes with the quality of the cycling or running training. Things might also be different for recreational participants vs. more elite athletes.
Summary, resistance training is a key component to overall fitness and health. The winter might be a good time to experiment and see what works for you. This is especially true for more competitive people who want to see if strength training their legs will improve their cycling or running.
In answer to both questions I would urge people to use the cold months to experiment and see what works for them. This will keep you mentally fresh and provide you with some new ideas for when warms up.
Bait & Switch: Longevity and the Medicare Eligibility Age
In a post last week I reviewed data on life expectancy and implications for the retirement age especially in the context of proposed changes in the eligibility of Medicare. Here is a link to a retirement age calculator for the U.S. Social Security system. For those born after 1938 the age gradually increases to 67 for those born in 1959. The retirement age for Medicare is currently 65, but up for discussion in the ongoing debates about the fiscal future of the U.S.
The idea driving the Medicare debate is that people are living far longer than they were when the program was started and thus an upward adjustment is needed to make Medicare demographically realistic and limit the explosive (and unsustainable) increases in costs for this program as the baby boomers retire. Opponents of this idea point out gains in life expectancy have been uneven and that most of the gains have been in relatively well-off segments of the population. There are also significant life expectancy differences based on race, education and sex (women live longer). Thus, the idea is that raising the retirement age would be “unfair” to certain groups. As I pointed out last time, no one ever brings up the general “unfairness” of these programs to men which I find a bit puzzling but will leave to the pundits to sort out.
The counter argument about the potential unfairness of raising the eligibility age for Medicare is that the real problem is what happens to or in the groups with lower life expectancy before age 65. In other words, the differences in life expectancy in various subgroups for those who make it to 65 or older in pretty good health are less dramatic than the differences in life expectancy from birth data would suggest. What follows are some examples of what happens to people before age 65 that might explain some of the socioeconomic differences in life expectancy.
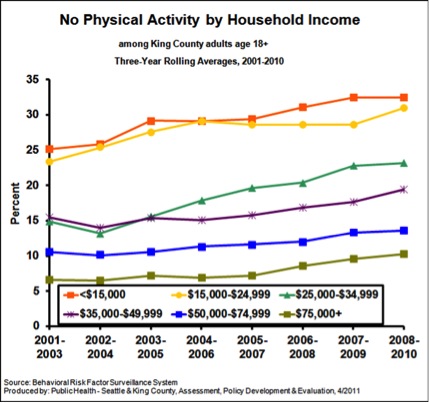
Physical Activity
The figure below is from King County, Washington (Seattle) and shows data on the influence of income on “no physical activity in the last month”. As I have pointed out repeatedly, physical activity is extremely protective against all sorts of problems and increases longevity dramatically.
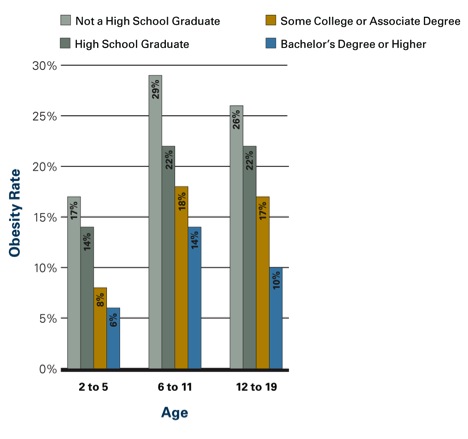
Obesity
The figure below shows the influence of parental education on obesity rates in kids. Similar data is available for adults. In adult women those with more education and higher incomes are less likely to be obese. In men the relationship is not as clear, but there is some evidence that better educated men are less obese the less educated men. However, the bad news is that obesity has increased for both sexes and all socioeconomic and racial subgroups in the last 20 plus years.
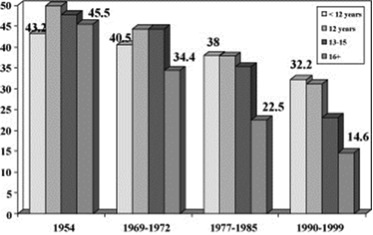
Smoking
The figure below shows data on smoking rates by education (usually a close correlate of income) and how they have changed between 1954 and the 1990s. Rates have fallen for all groups but most dramatically for the most educated people.
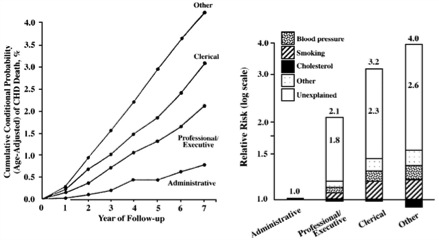
Social Stress
There is pretty good evidence that social status and what might be described as social stress and autonomy plays a role in the early mortality seen in less educated and lower socioeconomic status groups. In other words, poor and less educated people have less control over their daily lives and that is stressful and bad for their health. Social stress is also independent of traditional risk factors or access to care. The figure below shows how job category/education affects cardiovascular mortality in civil servants in England. The bar graph on the right of the figure is a “log-scale” so a bit distorted, but the overall picture is clear. The article points out that:
The cardiovascular mortality rate over 7 years in 17 530 London civil servants was more than 4% among unskilled workers, compared with 3% among clerical workers, 2% among professionals or executives, and less than 1% among administrators. The presence of identified risk factors, including cholesterol level, blood pressure, and smoking, explained less than half of these differences. All of these persons were working at the onset of the observation period and had access to medical care through the National Health Service. Therefore, neither biomedical risk factors nor limited access to medical care can account for most of the differences, and the major component of differences in the risk for cardiovascular death remains. We suggest an explanation based on lifestyle and behavioral considerations.
My bet is that the more educated and higher paid civil servants in the UK were much more likely to be physically active, watch their diets and otherwise comply with health guidelines and medical advice.
Summary
All sorts of issues including physical inactivity, obesity, smoking and social status/stress need to be addressed to reduce the effects of socioeconomic status, education and race on life expectancy. However, most or all of these issues need to be addressed prior to the age of 65 to have much of an effect on life expectancy. Most are also relatively independent of access to medical care. Confusing these issues, with the eligibility age for and long term finances of Medicare is an example of a policy discussion bait and switch.
BMI, Mortality & Health
There was a lot of attention in the press last week about a new report in the Journal of the American Medical Association (JAMA) showing that BMIs in the “overweight” category (25-30) are associated with lower overall mortality rates. This was accompanied by editorial comments about the need for people to calm down about the fact that U.S. in specific and the world in general is getting fatter. Before taking a deeper dive into the BMI vs. mortality argument here is a link to a post on BMI, and recent overweight/obesity trends in the U.S.
What is the relationship between BMI and mortality?
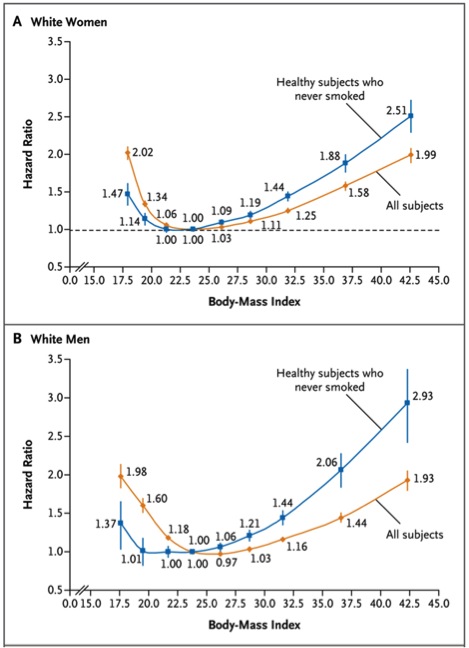
The figure below is from a study of almost 1.5 million whites between the ages of 19 and 84 with a median age of 58. This study has a couple of advantages over the JAMA study especially because it was prospective as opposed to a meta-analysis of prior studies. However, it is restricted to only one racial group. The study also shows that the relationship between mortality and BMI does not really “take off” until people get into the obese (BMI > 30) range. However it is not as reassuring as the JAMA study and mortality does start to creep up in the overweight (BMI 25-30) range. The study concludes that:
“In this large, pooled analysis of prospective studies, both overweight and obesity (and possibly underweight) were associated with increased all-cause mortality in analyses restricted to participants who never smoked and did not have diagnosed cancer or heart disease. Thus, analyses of this subgroup should be minimally confounded by smoking or prevalent illness. The associations were strongest among participants whose BMI was ascertained before the age of 50 years. The lowest all-cause mortality was generally observed in the BMI range of 20.0 to 24.9. Longer follow-up attenuated the associations with lower BMI levels.”
BMI Caveats
The small increases in mortality for the overweight and mildly obese are somewhat reassuring; but the whole relationship between BMI and health is tricky. There are high BMI people who have a lot of muscle mass and not much body fat, and there are low BMI people with a lot of fat who have poor health and increased mortality. This has been termed normal weight obesity, and suggests that low muscle mass can also be a problem. Low muscle mass might also explain some of the mortality issues in people with very low BMIs (<20). There are also high BMI people with plenty of body fat who have normal cholesterol and glucose who are “metabolically healthy”. Thus, there are several patterns of body composition and BMI does is not that predictive on an individual basis. In general abdominal obesity tends to be a bigger problem than fat other places. Here is a link to a Wiki site on abdominal obesity that is informative. Finally, exercise can also modify the relationships between BMI and metabolic health in people in the overweight and obese categories. This is the whole “fit vs. fat debate”.
Mortality vs. Health?
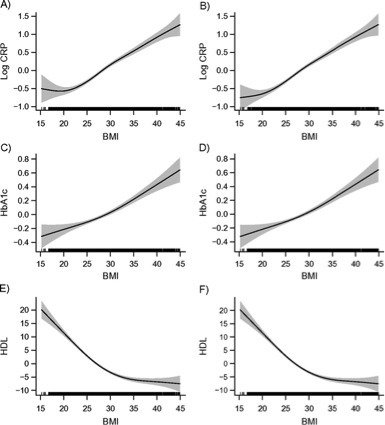
The BMI mortality data does not tell us much about overweight/obesity and health, and this data is hard to come by. However, there is good evidence that so-called biomarkers of disease risk show a more linear vs. U-shaped relationship between BMI and the marker of interest than between BMI and mortality. The figure below shows this for men with data from a large national survey. CRP is a marker of inflammation related to heart disease risk, HBA1c is a marker related to diabetes, and HDL is so-called “good” cholesterol. The panels on the left were statistically adjusted for age and the panels on the right for age and smoking. In the long run the increased risk factors associated with higher BMIs will likely translate into poorer overall health for many people. The authors conclude that:
”These findings imply that obesity researchers should exercise caution when interpreting mortality findings in broader health terms. From a public health perspective, the findings suggest that even moderate levels of overweight may indicate worse health risk profiles than lower body weights, with potentially important implications for chronic disease and health-related quality of life……”
Summary
The relationships between BMI, mortality and health are complicated. Based on the data above we probably should take the “don’t worry” interpretation of the findings in the JAMA paper promoted in the mass media with more than a grain of salt. We also need to think about overweight and obesity using more sophisticated measures of body composition, and a one size fits all BMI based approach to these issues leaves a lot to be desired. The data from the “normal weight obese” and “fit vs. fat” studies along with the very low BMI subgroups in the big population studies suggest that the role of active muscle mass in our overall health is underappreciated. Finally, people tend to gain weight over the years and many of the overweight of today are likely to be the obese of tomorrow.
You are currently browsing the Human Limits blog archives for January, 2013.
LIKE MIKE

SUBSCRIBE TO RSS
